
All data will form a distribution which can be described by three descriptors. The three statistical descriptors will tell you about the central tendency, variation and shape of your distribution of data values. This article will define the different descriptors and what they can tell you about your process.
Overview: What are descriptive statistics?
Let’s start by defining the concept of statistics. Statistics is the discipline and science used for collecting, organizing, analyzing, interpreting, and presenting data.
Descriptive Statistics is the field of statistics which defines or characterizes a population based upon the values of your sample data points taken from that population. A Population is made up of all the values fitting a particular description taken from a product, service, or process.
- Parameters (or population parameters) are terms used to describe the key characteristics of a population
- Parameters are usually denoted by a lowercase Greek letter
- The letter N is used to describe the number of values in a population (the population size) when the population size is not infinite
The three descriptors used in the descriptive statistics of your data are:
- Central Tendency is the property that data tends to group around a center point
- This center may be the mathematical average, the data point in the center of the data set or, the most frequently occurring data value
- These are referred to as the Mean (mathematical center), Median (physical center), and Mode (most frequently occurring value)
- Variation describes the spread or dispersion of your data
- The three common measures of variation are the range, standard deviation and variance
- Distribution or shape of your data
- By examining the distribution, you can see patterns that may difficult to see in a simple table of numbers
- Different processes and phenomena will generate different distribution patterns
- Both common cause and special cause variation may be observed in the distribution
- The most common distribution or shape is the normal distribution
- Kurtosis and Skewness are statistical measures of shape
3 benefits of descriptive statistics
Descriptive statistics provides a more complete picture of your process allowing you to better understand what is happening and what decisions you should make regarding your process.
1. Easy calculations
Given the power and flexibility of today’s statistical software, the calculations for central tendency, variation and shape are easy to do.
2. Provides a complete description of your data
An average or mean without a measure of variation or dispersion only tells you a part of what is going on in your process. By including a measure of variation and shape, you now have a more complete description of your data and the process you got the data from.
3. Inferences about the population parameters
Using the descriptive statistics from your sample, you can make inferences about the population parameters. This is the basis of inferential statistics.
Why are descriptive statistics important to understand?
Here are a few reasons why descriptive statistics are important to understand.
Provides a basis for visual presentation
There are a number of graphical tools which can be used in conjunction with the descriptive statistics to allow for easier visualization of the data.
Easier to spot patterns than just using raw data
Patterns and trends can be identified easier than just looking at rows and columns of raw data.
Can be used for both discrete and continuous data
Descriptive statistics applies to both discrete and continuous data although the calculations for computing central tendency and variation are different.
An industry example of descriptive statistics
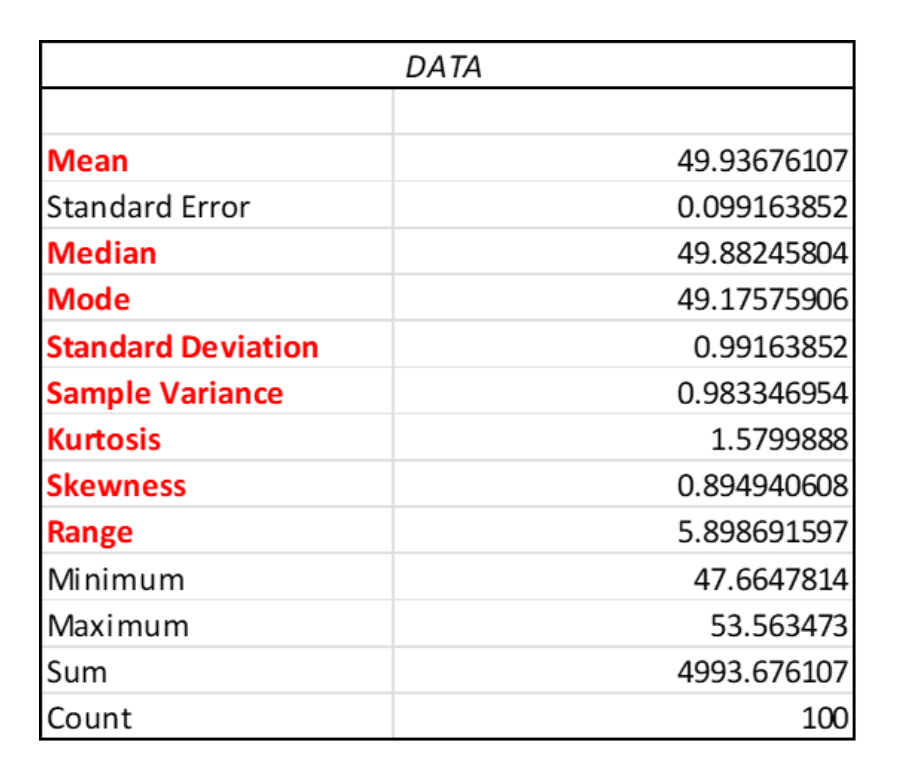
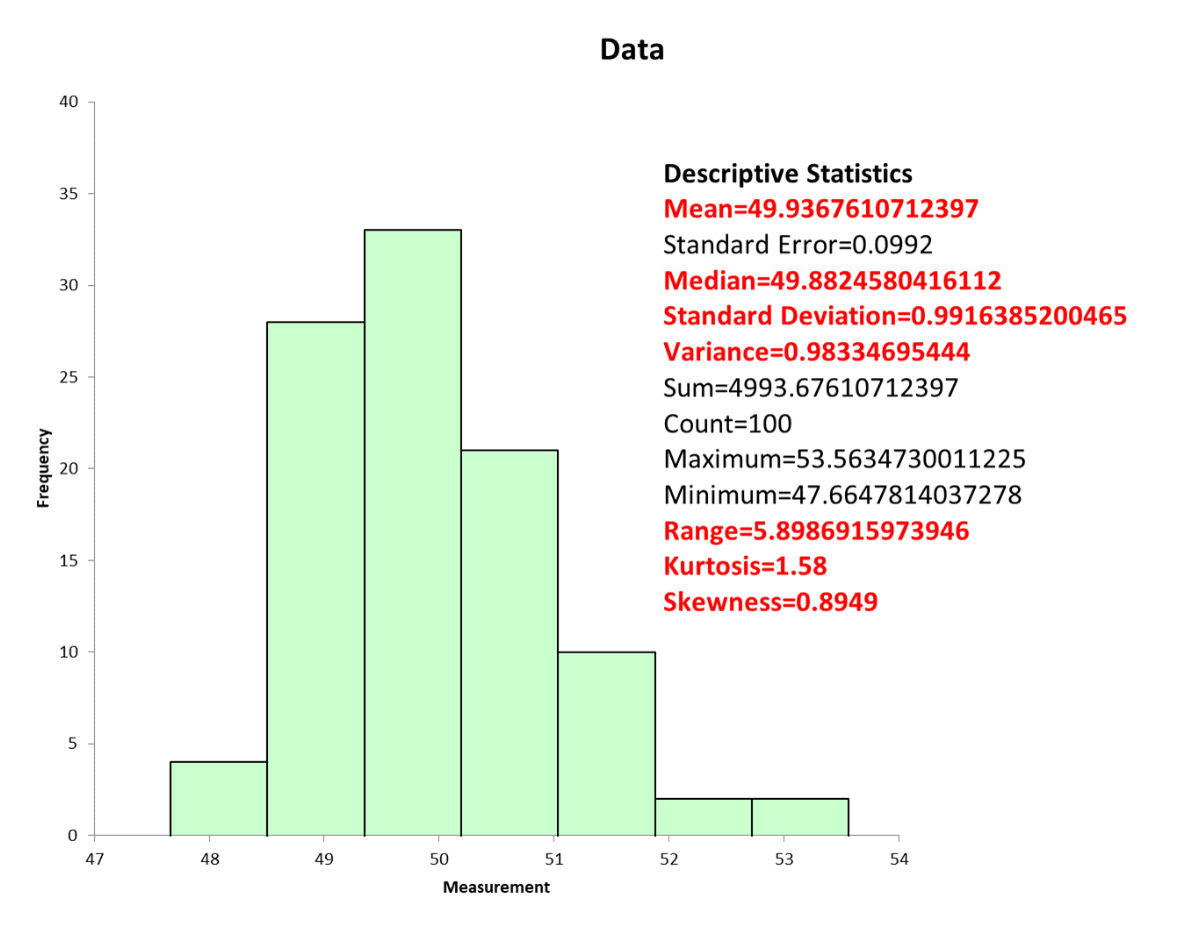
Here is the output from Excel and a statistical software package showing the descriptive statistics for a set of data. Note the statistical package also provides a histogram.
3 best practices when thinking about descriptive statistics
Statistical software makes the computation of descriptive statistics very easy. But, there are still some considerations you need to think about.
1. What type of data are you using?
Since the calculations for the descriptive statistics of discrete and continuous data are different, you must first determine what type of data you are seeking to analyze.
2. Do a Measurement System Analysis (MSA)
Before doing any computation of descriptive statistics, you must determine whether you can trust the measurement system which captured your data. Use MSA for both discrete and continuous data to confirm the validity and integrity of your measurement system.
3. Use graphical presentations as often as feasible
The old adage of a picture being worth a thousand words applies to descriptive statistics. Use graphical presentations to display your information as often as possible.
Frequently Asked Questions (FAQ) about descriptive statistics
What are the three types of descriptive statistics?
They are central tendency, variation and frequency distribution.
What are the three descriptive statistics for central tendency?
The mean (mathematical center), median (physical center), and mode (most frequently occurring value).
In descriptive statistics, what is the difference between the standard deviation and the variance?
The standard deviation is the square root of the variance. A major benefit of the standard deviation is that it is the same terms as the data. The advantage of the variance is that it can be used in mathematical calculations whereas the standard deviation cannot.
Wrapping up Descriptive Statistics
To fully understand what your data is telling you about your process, you must have a full description of your data. Descriptive statistics are the mathematical representation of the central tendency, variation, and shape of your data. Not using all three will result in an incomplete picture of your data and process. You can use statistical software or even Excel to do the calculations for you.