
The Gamma coefficient tells you how closely two pairs of ordinal data points match or are correlated. The estimator of Gamma uses the number of concordant and discordant pairs of X and Y observations. Tied pairs are ignored.
Overview: What is Goodman-Kruskal Gamma?
The Gamma statistic was first proposed in a series of papers from 1954 to 1972 by Leo Goodman and William Kruskal. Gamma can be calculated for continuous ordinal (ordered) data such as height, time or age. It can also be used for discrete data like good, better and best.
The calculation of Gamma is based on two quantities:
- Nc, the number of pairs where the ranked values are the same for both variables. This is called the concordant pairs.
- Nd, the number of pairs where the ranked values are in reverse order for both variables. This is called the discordant pairs.
- Ties, where the values of paired data are equal, are ignored.
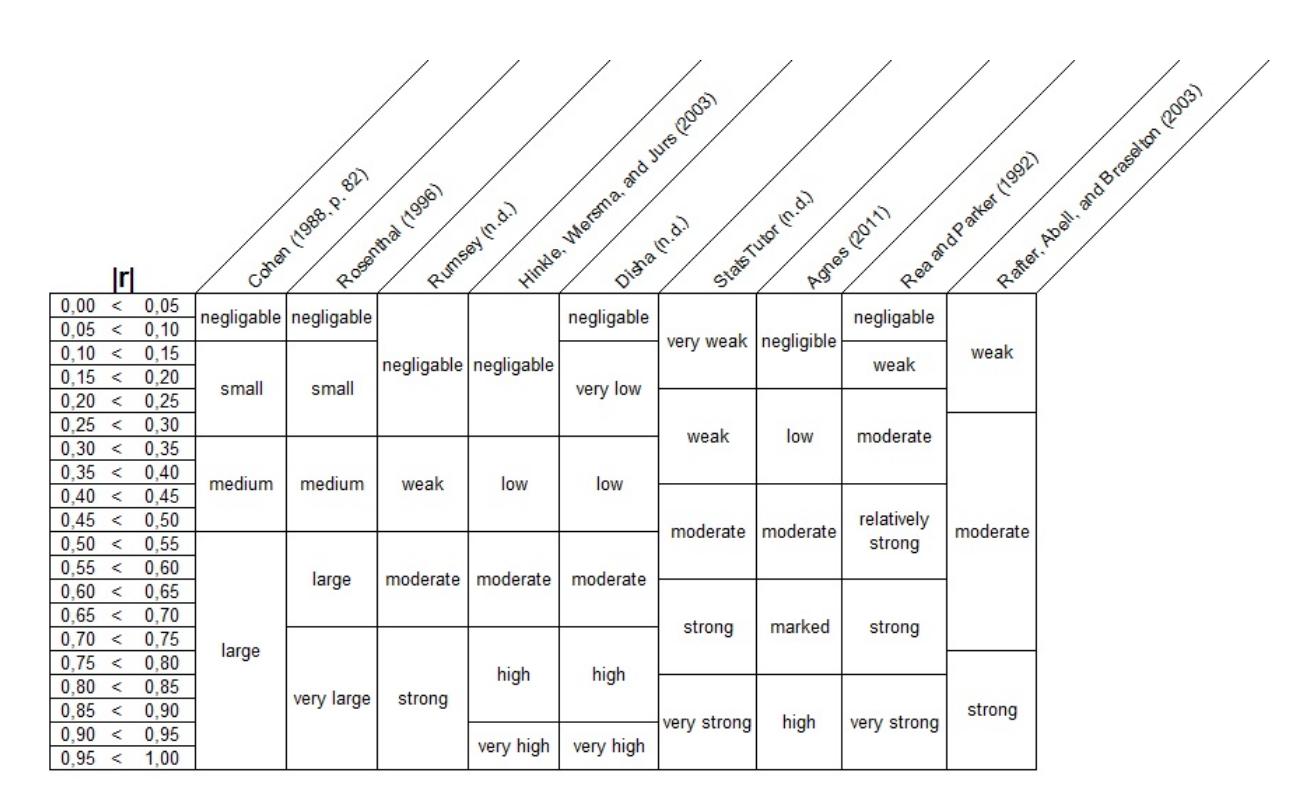
The closer you get to 1 (+1 or -1), the stronger the association or correlation. You can determine the statistical significance by calculating a p-value or use a rule of thumb. Gamma can be interpreted as the proportion of ranked concordant pairs. For example, if Gamma = +1, you can interpret that to mean every pair in your ranked data agrees and are a match. Here is a table of common rules of thumb by various authors:
An industry example of Goodman-Kruskal Gamma
HR was analyzing operator data on hours spent studying for a job related test versus how well they did. Their hypothesis was that more studying should lead to better test results. A simple 2×2 contingency tables was setup as below:
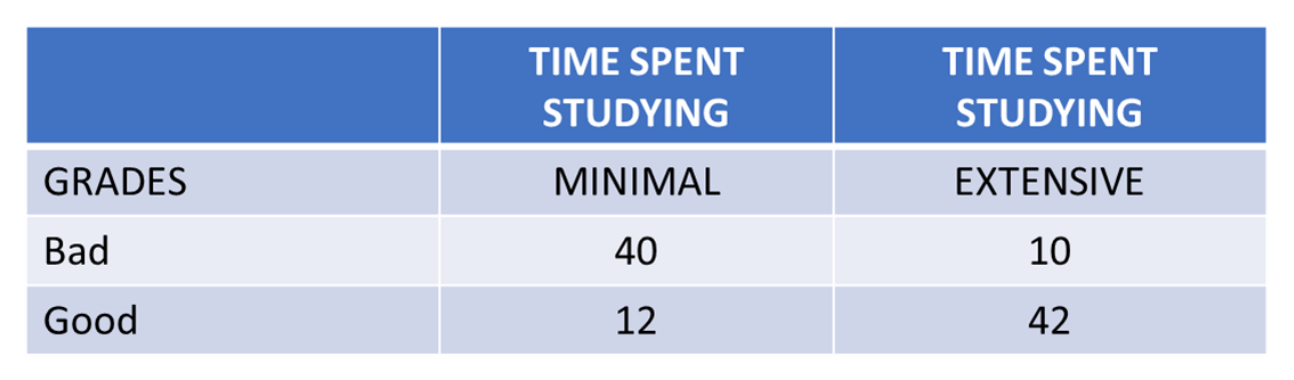
The cells for MINIMAL time/Bad scores and EXTENSIVE time/ Good scores support their hypothesis that studying and test results have an association and are concordant. The other two cells are the reverse of what would be expected.
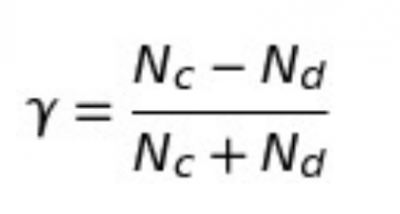
Gamma was calculated as follows:
- Start with the concordant pairs. Nc = 40 * 42 = 1680,
- Now calculate for the discordant pairs. Nd = 10 * 12 = 120.
- The gamma statistic is:
(Nc – Nd) / (Nc + Nd) = (1680 – 120) / (1680 + 120), or 0.867.
Since the Gamma value is relatively high compared to +1, the HR manager can comfortably conclude that studying helps with test scores.
Frequently Asked Questions (FAQ) about Goodman-Kruskal Gamma
How do you interpret the Goodman-Kruskal Gamma?
Gamma is a measure of correlation used for ordinal variables. Gamma values will range from -1.00 to 1.00. A value of 0.00 indicates there is no correlation. A value of 1.00 indicates a perfect positive correlation and a value of -1.00 indicates a perfect negative correlation between your variables.
What do Goodman-Kruskal Gamma values between +1 and -1 tell me about the relationship between my two variables?
There are many rules of thumb depending on the type of industry. Here is a common one by Rea and Parker (1992):
0.00 < 0.10 – Negligible
0.10 < 0.20 – Weak
0.20 < 0.40 – Moderate
0.40 < 0.60 – Relatively strong
0.60 < 0.80 – Strong
0.80 < 1.00 – Very strong
Is there a null hypothesis associated with the use of Goodman-Kruskal Gamma?
Yes. The null hypothesis states there is a relationship or association between your sets of ordered and ranked data. The alternative hypothesis is there is no relationship, association or correlation.