
While the term in-control sounds like something positive, that’s not always the case. Let’s examine what in-control means and how it impacts your decision-making.
Overview: What does it mean to be in-control?
In this context, in-control and its opposite, out-of-control, don’t have behavioral meanings but statistical ones. The statistical control chart, developed by Dr. Walter A. Shewhart, has the purpose of looking at your process performance and discriminating between what he called common cause variation and special cause variation.
Common cause variation is the variation in your process caused by the variation in your process elements. That is, the variation of the people, materials, methods, equipment, environment, and the other components in your process often referred to as the 6Ms. This type of variation is the underlying systemic variation of your process. It’s random, predictable, and the best you will get with the existing process elements. It doesn’t mean it’s good or acceptable. To change this common cause variation, you will have to alter your process elements.
Special cause variation is the variation due to some hiccup or unpredictable occurrence in your process. Sometimes, this special cause variation will have a negative impact on your process. Other times, this special cause may result in something unpredictably good. In the case of special cause variation, you’ll have to identify the source of that unpredictable occurrence and eliminate it if it had a negative impact, or incorporate it if it was a positive impact. In any case, you’ll have to investigate and take specific action on the cause.
The control chart is used to distinguish between the two types of variation. Calculations are done to establish upper and lower control limits to help you make the decision as to the type of variation that you’re seeing. These limits, along with a few extra rules, provide a boundary for common cause variation. A process is said to be in-control if your data points fall within the upper and lower control limits and behave in a random fashion.
But, you can be in-control and produce defective products. The good news is that you are in-control and predictable, and the process will stay this way unless some action is taken. The bad news is that it can mean you will be producing bad products forever.
2 benefits of being in-control
I guess it would be better if your kids were in-control rather than being out-of-control, but what about when it comes to your processes?
1. Predictability
When talking about control charts, being in-control means your process is exhibiting common cause variation and is predictable. Greater predictability allows for better planning.
2. Stability
A process that is in-control is stable, so we wouldn’t expect to see any wild unforeseen fluctuations. Stability doesn’t necessarily mean good. Your blood pressure could be stable at 200/90. The good news is that it is stable and predictable. The bad news is that your physician might predict that you are a good candidate for a stroke.
Why is being in-control important to understand?
Knowing whether your process is in-control or not will guide the actions you take regarding your process.
Appropriate action
If your process is in-control, don’t waste time looking for the cause of an individual point that might be higher or lower than you expected. If you throw a pair of dice and get a 4, don’t start an investigation of why you got a 4. A fair pair of dice will result in some 4s.
Asking people to chase random variation is fruitless. If your process is in-control and you aren’t happy, then change the process elements. It requires a systemic change.
Tampering
Chasing common cause variation for a process that is in-control can lead to tampering. If your control chart tells you your process is in-control, don’t react to an individual point and change your process. This tampering will result in even more variation.
While beyond the scope of this article, check out this link to Dr. W. Edwards Deming’s famous funnel experiment.
Process capability
Calculations of process capability require that your process be in-control and only exhibiting common cause variation. Process capability is a forward-looking metric, and thus, you would want your process to be stable and predictable.
An industry example of being in-control
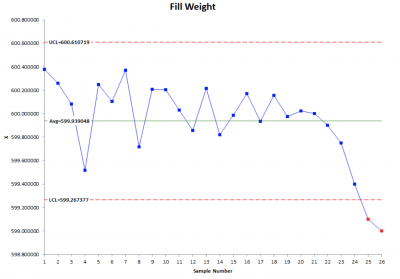
A consumer products company, producing orange juice, started to see an uptick in the number of juice cartons that were being rejected on the fill line. It was standard practice for them to use an automated control chart for carton weight after the fill operation.
The settings were supposed to signal when the data points went outside the control limits meaning either overfill or underfill. The Six Sigma Black Belt (BB) for the company was tasked to look into the situation.
What the BB saw was that there were ample signals of the process going out-of-control, but the system never picked it up. The cause was obvious. As the juice heads dispense the juice into the carton, there is a buildup of pulp in the dispensing valve that eventually shuts down one of the four valves used for the filling operation.
A quick glance at the control chart revealed the problem. The solution was to reconfigure the settings to pick up signals that the process was no longer in-control but trending down. The signal was based on one of the Western Electric Rules. See the chart below.
4 best practices when thinking about being in-control
How do you know whether your process is in-control or not? The proper use of control charts will be the key.
1. Use the appropriate control chart
The type and amount of data are the controlling factors for which type of control chart to use. Using the wrong chart will give you false signals and cause confusion as to whether you are looking at your process being in-control or not.
2. Don’t overreact to a process in-control
The proper reaction to a process in-control is to change the process inputs in a systematic fashion, and not to chase or tamper with the process based on a single data point that might seem high or low.
3. Use the Western Electric Rules
Being in-control is shown on your control chart by having all the points within the upper and lower control limits. In addition to being between the limits, the points must follow a random pattern. The Western Electric Rules describe non-random patterns that can occur that will indicate whether your process is really in-control or not.
4. Don’t improve until you are in-control
If you make a process change without your process being in-control, you don’t really know whether what you observe next is due to the change you made or some unpredictable hiccup. If your process is not in-control, then there is no real predictability.
Frequently Asked Questions (FAQ) about being in-control
Is being in-control a good thing?
It depends. Being in-control means the process is stable and predictable. But, if your process is producing defective output, then being in-control only means that your defects are predictable and stable. It also means that you will be sending bad products to your customer until you take some action on the entire system.
How do I know if my process is in-control?
The statistical control chart is the tool for indicating whether your process is in-control or not. If your data points are falling within the calculated control limits and are random, that’s an indication that your process is in-control.
What do I need to do to bring my process in-control?
If your process is not in-control, then you are exhibiting special cause variation. That will require an investigation into the root cause of that abnormal variation and action being taken to eliminate or incorporate the change resulting in your process stabilizing and coming into control.
Final thoughts
A process in-control means that it is stable, predictable, and random. It does not necessarily mean that your process is functioning well and producing a quality output. The control chart is used to determine whether or not your process is in-control.