
The term linear relationship seems to infer a relationship that would follow a line, hence the term linear. You can also have a curvilinear relationship that would follow a curve. Let’s explore the concept of a linear relationship.
Overview: What is a linear relationship?
The concept of a linear relationship between two variables usually comes up in the context of simple linear regression. In simple linear regression, you are attempting to establish whether the relationship between your X and Y variables is linear. This would mean as your X variable goes up, your Y variable would go up or down in sync with your X variable. A perfect linear relationship would have your Y go up or down one unit as your X went up one unit.
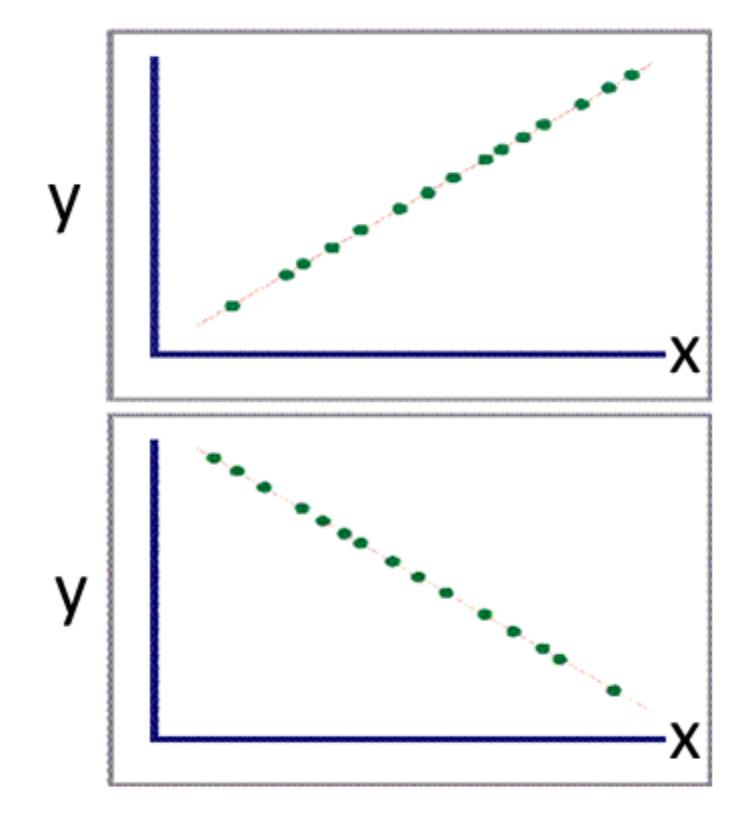
If your X goes up one unit and your Y goes up one unit we would say your linear relationship would have a positive correlation. If your X went up one unit and your Y went down one unit, you would have a negative correlation. The two scatter plots below show a perfect positive and negative linear relationship or correlation.
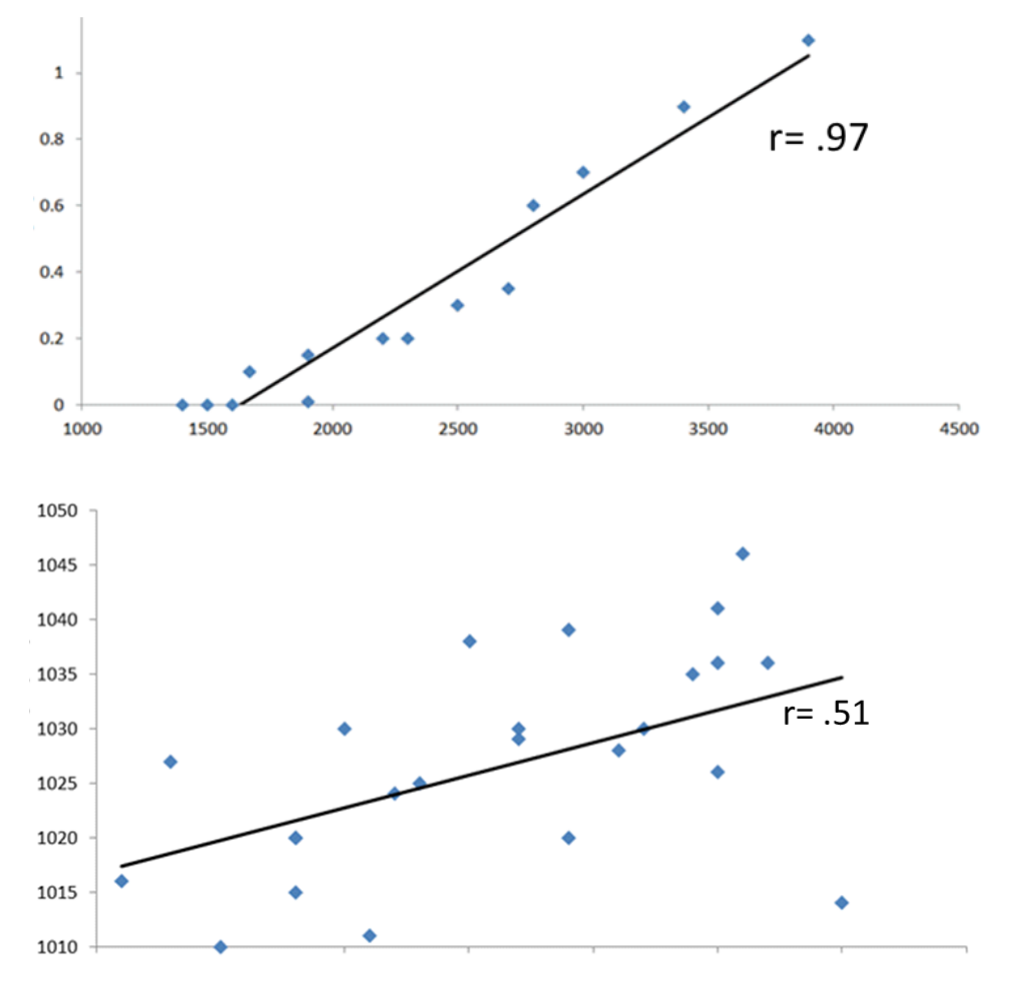
It is very rare your data will present as a perfect linear relationship or correlation. A common measure for determining the degree of linear relationship is the Pearson correlation coefficient. Values for the Pearson correlation designated as r, will range between -1.0 (perfect negative linear) and +1.0 (perfect positive linear) with 0 meaning no linear relationship or correlation. The closer to 1 on either side indicates how strong the linear relationship is. Below are two scatter plots showing a strong and weak linear relationship based on the graphical relationship to a straight line and the value of the Pearson correlation.
An industry example of a linear relationship
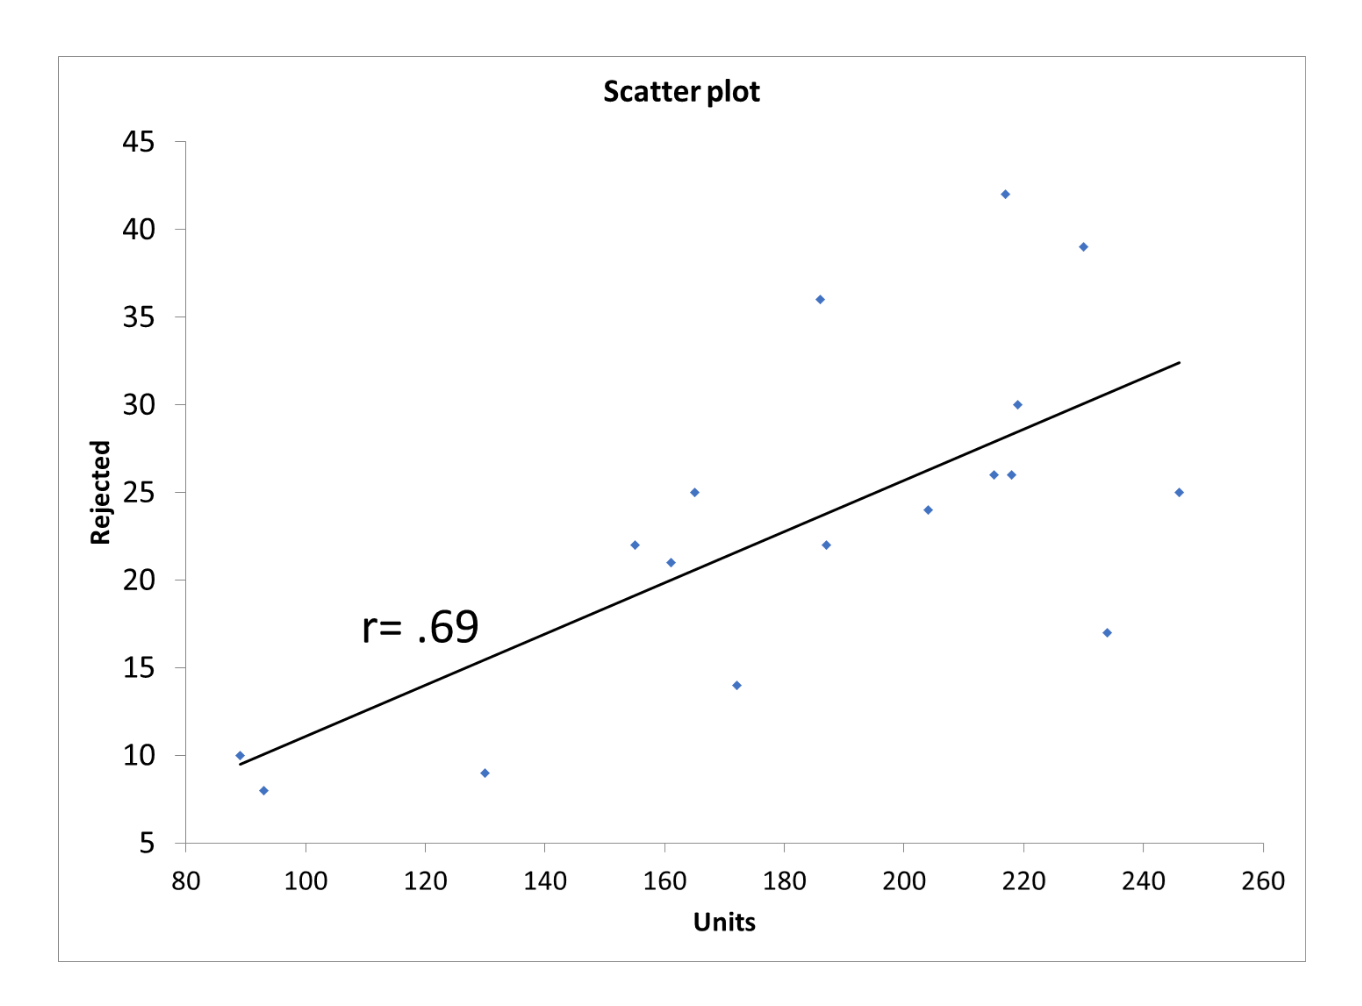
The plant manager for a glass company believed there was a linear relationship between the number of units produced and the number of rejected units. He did a quick scatter plot and while visually it doesn’t appear to be a strong linear relationship, the r value of 0.69 showed it to be relatively strong. The scatter plot below shows the output from his statistical software.
Frequently Asked Questions (FAQ) about a linear relationship
What does a strong linear relationship look like on a graph?
All the points will fall on or near the calculated regression line.
Is there a way to measure the statistical strength of a linear relationship?
Yes. The Pearson correlation is a common statistical calculation measuring the strength of the linear relationship. Its values range between -1 and +1. A value of zero means there is no linear relationship. The closer the value is to 1, either positive or negative, the stronger the linear relationship.
What is the Coefficient of Determination?
The Coefficient of Determination, written as r-square, is the square of the Pearson Correlation Coefficient. It defines the percent variation in your Y that is explained by your X.