
If you are trying to predict the outcome of a dependent variable by analyzing the relationship with several independent variables, then multiple regression may be your statistical tool of choice. Let’s examine multiple regression in more detail.
Multiple regression is a statistical technique that allows you to analyze the relationship between a dependent variable and multiple independent variables. In multiple regression, the dependent variable is typically a continuous variable, while the independent variables can be either continuous or categorical.
Overview: What is multiple regression?
The goal of multiple regression is to create a model that can predict the value of the dependent variable based on the values of the independent variables. The model is created by estimating the correlation coefficients of the independent variables, which represent the strength and direction of the relationship between each independent variable and the dependent variable. This can help identify which independent variables are the most important in predicting the value of the dependent variable, and to test hypotheses about the relationship between the variables.
Multicollinearity is a statistical issue that arises when two or more independent variables in a multiple regression model are highly correlated with each other. This can cause problems in the analysis of the model because it can make it difficult to determine the unique contribution of each independent variable to the prediction of the dependent variable.
When there is multicollinearity, the estimated regression coefficients of the affected independent variables may be imprecise or unstable. The standard errors of the coefficients may also be inflated, which can lead to incorrect conclusions about the statistical significance of the independent variables. Correlations between the independent variables that are greater than 0.7 or 0.8 are typically considered to be problematic.
There are several ways to address multicollinearity, including:
- Dropping one of the correlated independent variables from the model
- Combining the correlated independent variables into a single variable
- Collecting additional data to help distinguish between the correlated independent variables
- Using a different modeling technique that is less sensitive to multicollinearity, such as ridge regression or principal component analysis.
The Variance Inflation Factor (VIF) is a measure of the degree of multicollinearity among the independent variables in a multiple regression model. The VIF assesses how much the variance of the estimated regression coefficients are inflated due to the presence of multicollinearity.
A VIF of 1 indicates that there is no multicollinearity, while a VIF greater than 1 indicates that there is some degree of multicollinearity. A commonly used rule of thumb is that a VIF greater than 5 or 10 indicates a high degree of multicollinearity, although the specific threshold may vary depending on the context of the analysis.
R-Squared adjusted (coefficient of determination) is a statistical measure in a multiple regression model that determines the percent of variance in the dependent variable that can be explained by the independent variables. The values range from 0 to 1 and account for the number of independent variables in the model. For example, an R-squared adjusted of .60 indicates that 60% of the variability observed in the dependent variable can be explained by the regression model. Generally, a higher R-squared adjusted value indicates a better explanation.
3 benefits of multiple regression
Multiple regression offers several benefits in statistical analysis, including:
1. Identification of important independent variables
Multiple regression can help you identify which independent variables are the most important in predicting the value of the dependent variable. This can help you to better understand the factors that influence the outcome of interest and to identify areas for further investigation.
2. Prediction and forecasting
Multiple regression can be used to make predictions or forecasts about the value of the dependent variable based on the values of the independent variables. This can be useful in many contexts, such as sales forecasting or economic analysis.
3. Testing of hypotheses
Multiple regression analysis can be used to test hypotheses about the relationship between the independent and dependent variables. This can help to determine whether the relationship is statistically significant and to identify the strength and direction of the relationship.
Why is multiple regression important to understand?
Multiple regression is important to understand for several reasons:
Improved prediction
Multiple regression can be used to make predictions or forecasts about the value of the dependent variable based on the values of the independent variables. This can help you make better decisions and to plan more effectively.
Improved understanding of relationships between variables
Multiple regression can help you identify which independent variables are most important in predicting the value of the dependent variable. This can help you better understand the factors that influence the outcome of interest.
Improved decision making
Multiple regression can be used to inform decision making by identifying the factors that are most important in predicting the value of the dependent variable. This can help you make more informed decisions and to allocate resources more effectively.
An industry example of multiple regression
The marketing department of a consumer products company was trying to predict sales based on the following factors:
- number of product displays in the store
- dollar spend on advertising
- dollar trade spend to the customer
- product pricing
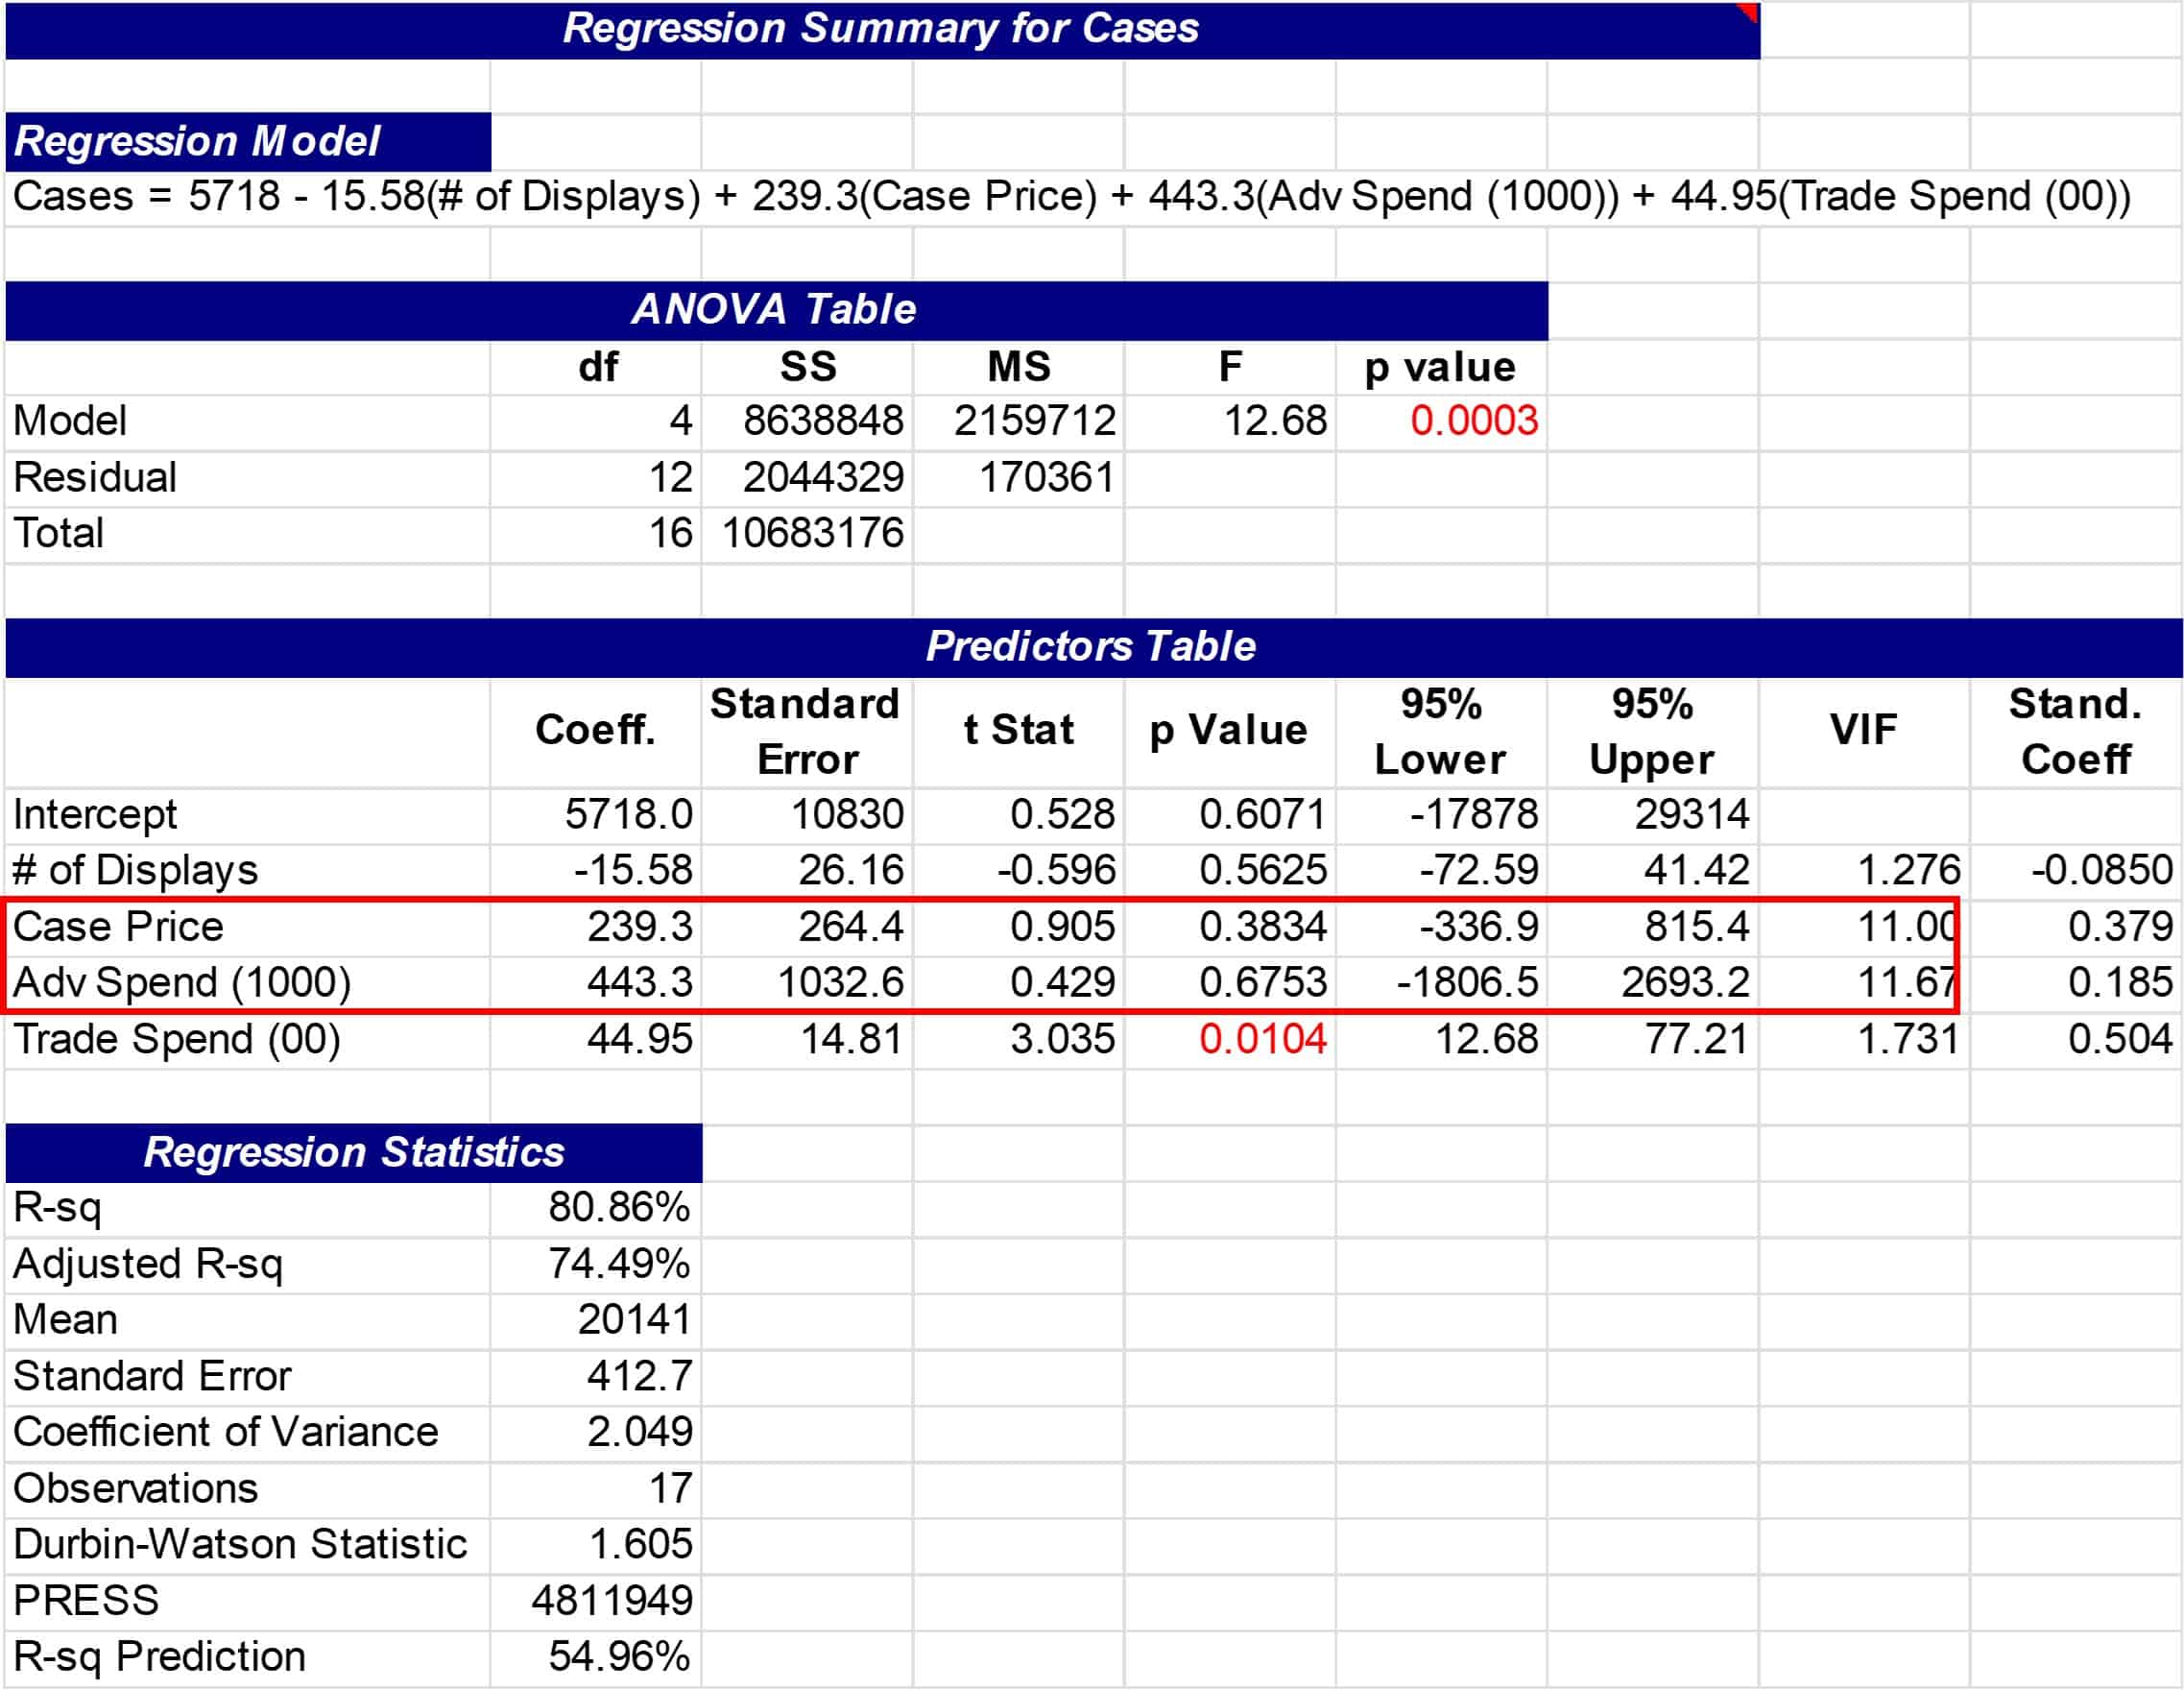
A multiple regression was run with the results shown below. Note that there is a high VIF of over 11 indicating a strong correlation between price and advertising spend. This multicollinearity renders the original results questionable. Since advertising spend is easier to manage, price was eliminated from the equation and the model was run again.
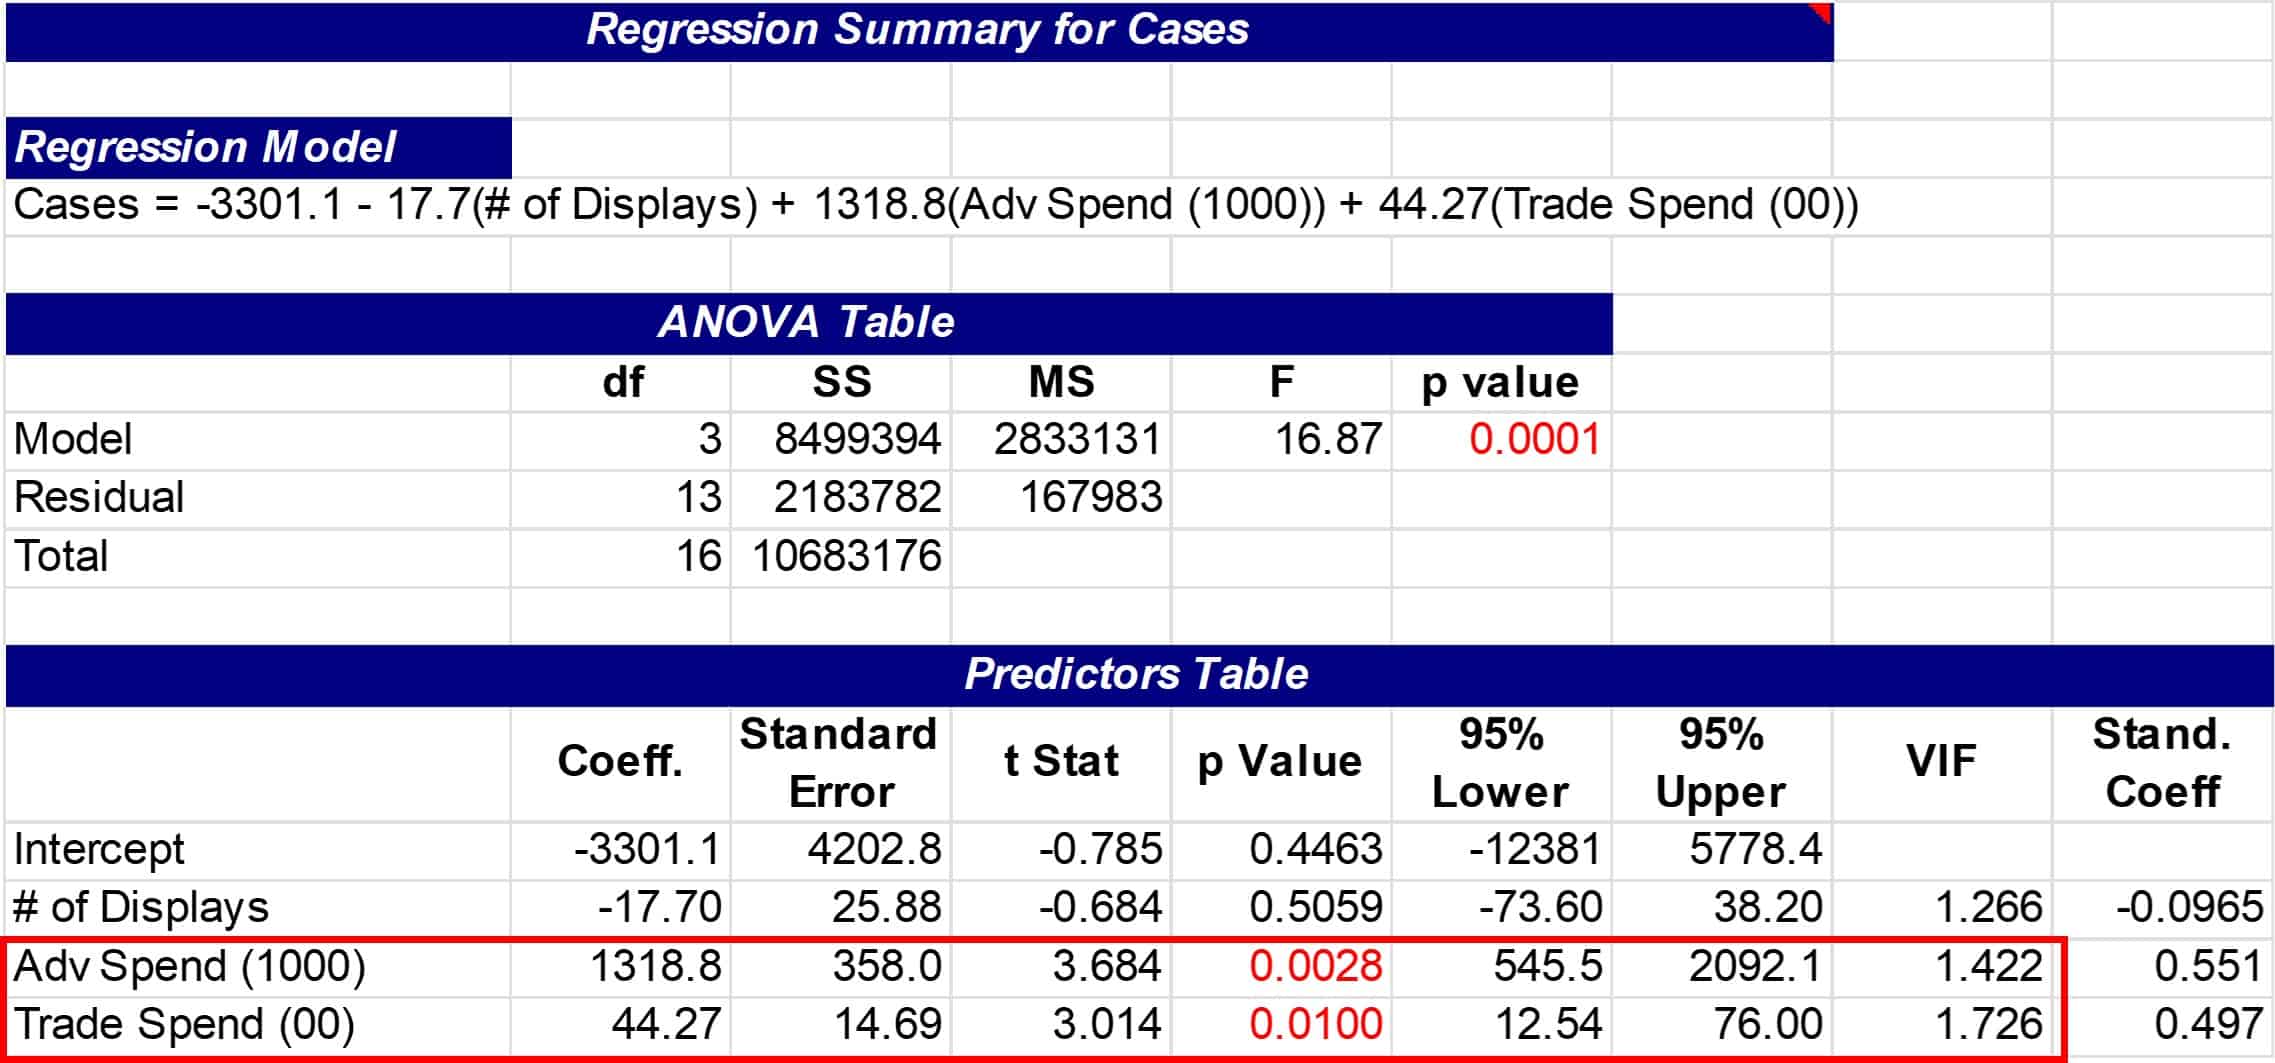
This time note that the VIF values indicate no significant multicollinearity, but the number of displays is not significant. The number of displays was eliminated because the high p-value indicated that it was not significant, and the model was run again with advertising and trade spend.
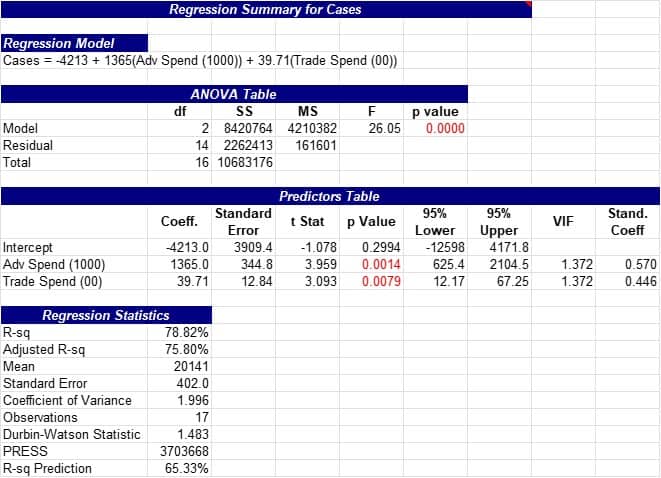
Below you see that advertising and trade spend are significant with an R-squared adjusted of 75.8% which says predicated sales using advertising and trade spend as the independent variables will provide a good predictor of sales.
Best practices when thinking about multiple regression
Here are some best practices for using multiple regression effectively:
1. Clearly define the research question
Before applying multiple regression, it is important to clearly define the research question and the dependent variable that needs to be predicted.
2. Choose appropriate independent variables
The independent variables that are included in the model should be theoretically relevant and empirically justified.
3. Check for outliers and influential observations
Outliers and influential observations can have a strong impact on the results of a multiple regression analysis. It is important to check for and address outliers and influential observations to ensure the accuracy and reliability of the results.
4. Address multicollinearity
Multicollinearity can lead to unstable or imprecise estimates of the regression coefficients. It is important to detect and address multicollinearity by examining the VIF values for the independent variables and using appropriate methods to reduce the impact of multicollinearity.
5. Check for normality and linearity
Multiple regression assumes that the errors or residuals are normally distributed and that the relationship between the independent and dependent variables is linear.
6. Validate the model
The multiple regression model should be validated by checking its predictive power and assessing its performance on new or out-of-sample data.
Frequently Asked Questions (FAQ) about multiple regression
What is multiple regression?
Multiple regression is a statistical technique that allows you to analyze the relationship between a dependent variable and multiple independent variables. The goal of multiple regression is to create a model that can predict the value of the dependent variable based on the values of the independent variables.
What is the difference between simple and multiple regression?
Simple regression involves analyzing the relationship between two variables: a dependent variable and a single independent variable. Multiple regression involves analyzing the relationship between a dependent variable and multiple independent variables.
How is the strength of the relationship between variables in a multiple regression model measured?
The strength of the relationship between variables in a multiple regression model is typically measured by the coefficient of determination (R-squared) or the correlation coefficient (r).
What is multicollinearity and how does it affect multiple regression analysis?
Multicollinearity is a statistical issue that arises when two or more independent variables in a multiple regression model are highly correlated with each other. This can cause problems in the analysis of the model because it can make it difficult to determine the unique contribution of each independent variable to the prediction of the dependent variable.
What is the VIF, and how is it used in multiple regression?
The Variance Inflation Factor (VIF) is a measure of the degree of multicollinearity among the independent variables in a multiple regression model. The VIF assesses how much the variance of the estimated regression coefficients are inflated due to the presence of multicollinearity. The VIF is used to detect and address multicollinearity in the model.
Let’s summarize our discussion of multiple regression
Multiple regression is a statistical technique used to analyze the relationship between a dependent variable and two or more independent variables. The goal of multiple regression is to find the best linear relationship between the dependent variable and the independent variables.
In multiple regression, the dependent variable is predicted by a linear combination of the independent variables. The prediction equation for a multiple regression is:
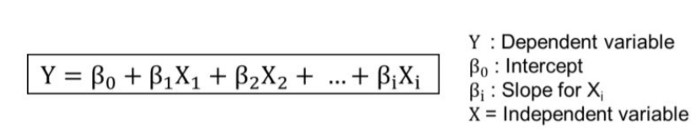
Multiple Linear Regression Equation
The coefficients represent the change in the dependent variable for a one-unit change in the corresponding independent variable, holding all other independent variables constant.
Multiple regression analysis can be used to determine the significance of each independent variable, as well as the overall fit of the model. This can be done by calculating the coefficient of determination (R-squared), which measures the proportion of the variation in the dependent variable that is explained by the independent variables.