On many occasions, you may want to establish the correlation or relationship between two continuous data variables. If you are interested in improving the value of your dependent variable (Y) you should understand which of your independent variables (Xs) are correlated with Y. If the correlation is high, this might be an indication to explore whether a change in the X will result in a change in Y.
Overview: What is Pearson’s Correlation?
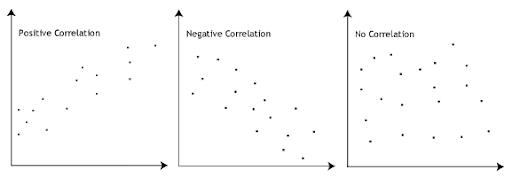
The Pearson correlation coefficient is a measure of the strength of a linear association between two continuous variables and is denoted by r. The Pearson correlation can range from +1 to -1. A value of 0 indicates there is no correlation between the two variables. A value greater than 0 indicates a positive correlation. This means as the value of your X increases, so does the value of Y. A value less than 0 indicates a negative correlation meaning as your X increases, the value of Y decreases. See the graphs below.
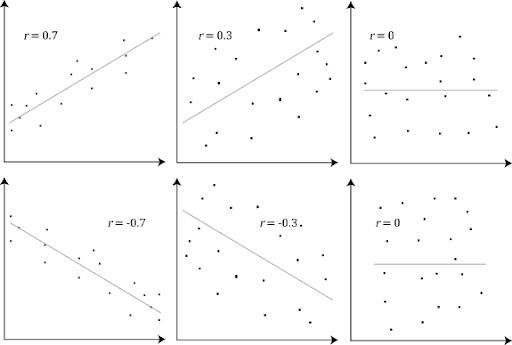
A value of +1 or -1 means all your data points are included on the line of best fit. Values for r between +1 and -1 indicate there is variation around the line of best fit. The closer the value of r to 0, the greater the variation around the line of best fit. Different values of r are shown in the diagram below:
The important thing to remember about correlation is it only shows the degree of relationship, it does not demonstrate causation.
An industry example of Pearson’s Correlation
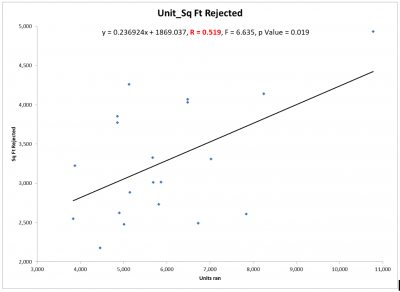
The superintendent of a large glass making plant wanted to determine if there was a correlation between the number of units produced and the amount of square footage of product rejected. Intuition told him there should be. His Black Belt (BB) helped him run the data which is shown below. You will note the correlation coefficient or r is .519 which is not a strong correlation. You can also see how far the data points are from the line of best fit. While there is correlation, he now needs to explain why the data shows it to be relatively weak.
Frequently Asked Questions (FAQ) about Pearson’s Correlation
1. Does Pearson’s correlation establish causality between my two variables?
No. Correlation shows the strength and direction of the relationship between your variables. It does not establish causation. This may need to be proven using Design of Experiments.
2. What are the smallest and largest values for the Pearson correlation coefficient?
The value of the Pearson correlation coefficient can range from +1 (perfect positive correlation) to -1 (perfect negative correlation. A value of 0 indicates no correlation between your two variables.
3. What is the formula for the Pearson correlation, r?
Where:
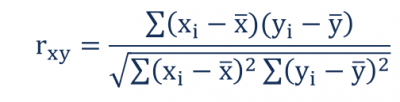
- rxy – the correlation coefficient of the linear relationship between the variables x and y
- xi – the values of the x-variable in a sample
- x̅ – the mean of the values of the x-variable
- yi – the values of the y-variable in a sample
- ȳ – the mean of the values of the y-variable