
When you have the average production of three machines, it is easy to calculate the average or mean production. You just add up the three means and divide by three. But what if I want the average standard deviation of the three machines. The pooled standard deviation is the way to go. Let’s see how.
Overview: What is a pooled standard deviation?
The definition of the standard deviation is the average distance each data point is away from the mean of the data. It is a measure of the variation, spread or dispersion of the data around the mean. The standard deviation is the square root of the variance. Unfortunately, according to mathematical theory you can’t do arithmetic operations with standard deviations, although you can with variances.
A pooled standard deviation is just a weighted average of the standard deviation (variances) from two or more groups of data when they are assumed to come from populations with a common standard deviation.
Weighting is a function of the sample size of each group. The larger the sample size, the greater the proportional effect will be on the overall estimate of the standard deviation.
Here is the generalized formula for the pooled standard deviation:
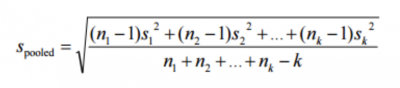
Formula for pooled standard deviation
In the formula above, n is the sample size of the group, S squared the group variance, and k the number of groups. This assumes the variances are essentially equal. If not, a more advanced formula is needed.
Note how a larger sample size in the numerator would have a larger impact or weighting on the final result.
Pooled standard deviations are used in hypothesis testing, ANOVA, control charts, and process capability analysis.
An industry example of pooled standard deviation
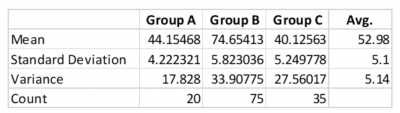
The manager of sales wanted to know the average sales of three offices as well as the variation as measured by the standard deviation. He easily calculated the average sales by adding up the average sales of his three offices and dividing by three.
He then tried calculating the average standard deviation by doing the same thing. He added the three standard deviations and divided by three to get an average of 5.1. Then he did the variances and got an average of 5.14.
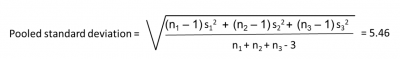
The company Lean Six Sigma Black Belt walked by, saw what he was doing, and suggested he needed to do the pooled standard deviation – not the straight average deviation. The problem was, he wasn’t accounting for the difference in sample sizes, so he was not properly weighting the standard deviations. The pooled standard deviation turned out to be 5.46.
Below are some of his calculations:
Frequently Asked Questions (FAQ) about pooled standard deviation
1. How do you calculate the pooled standard deviation?
To compute the pooled standard deviation for several groups:
- Calculate the difference between each value and its group means.
- Square those differences.
- Add them all up (for all groups).
- Divide by the number of degrees of freedom (total sample size minus the number of groups).
- Take the square root of the final number.
2. What is the major assumption when computing the pooled standard deviation?
The major assumption is the homogeneity of variances meaning the variances of the groups are essentially equal. It is not a problem if the means are different.
3. Where is the pooled standard deviation most used in statistics?
You will find the pooled standard deviation used frequently in hypothesis testing, primarily for 2-sample t-tests and analysis of variance (ANOVA).