
Statistical Process Control (SPC) is a powerful set of tools that let you monitor your process, identify sources of variation, and provide direction for taking action to make your process better. Let’s explore the specifics of each, the benefits of SPC, and how you can use these tools to better understand what your process data is telling you.
Overview: What is SPC?
Everything varies. Your time to drive to work varies from day to day. Your weight varies every time you get on the scale. Your process data varies every time you measure something. Variation is an expected outcome of every process. SPC will help you understand variation and guide you on how to react.
The primary tool of SPC, the control chart, was developed by Dr. Walter A. Shewhart in the 1920s. SPC was used extensively during World War II to increase the production of materiel for the U.S. war effort. At the conclusion of the war, Dr. W. Edwards Deming went to Japan and introduced SPC to Japanese engineers and business leaders.
Shewhart observed that operators on the line were frequently adjusting the settings on machines, resulting in excess variation of the output. Shewhart wanted to develop a simple tool to signal the operator when to adjust the machine and when to leave it alone.
The control chart was developed to signal when variation was a result of random variation, which Shewhart called common cause variation, or special cause variation, which resulted from some particular, identifiable, and assignable cause. He used this statistical tool to help control and manage the process.
The SPC technique plots process data over time. Control limits of expected or common cause variation are calculated from the data. If data points go outside of these limits or behave in a non-random manner, it’s a signal that special cause variation may be present. You should investigate the circumstances around that data point to see what may have caused it. If your process improved as a result of your process change, then implement it for continued improvement. If not, seek to eliminate the cause of the change.
3 benefits of SPC
Shewhart originally developed SPC and control charts to help operators manage their process better. Here are some other benefits.
1. Distinguish between common and special cause variation
The purpose of the control is to distinguish between common and special cause variation. By identifying the difference, you will know whether to take action or not.
2. Quick feedback
Once your data is plotted on the control chart, you will know whether it is common or special cause variation. This provides almost instantaneous, actionable feedback.
3. Reduced process variation
By only reacting and taking action on special cause variation, you will reduce unneeded process adjustments. Frequent process tampering and over adjusting only increase your process variation.
Why is SPC important to understand?
Today, most control charting is done by statistical software, so a complete understanding of the statistics is not needed. The important thing to understand is the interpretation of the control chart and the action you need to take.
When to take action and when not to take action
Rely on the control chart signals to indicate when you should investigate for special cause variation. If common cause variation is present, you should seek to improve the process and not look for a reason to explain a single point.
SPC can be applied to any process
There are control charts for any type of data. They can be applied to continuous or discrete data as long as the data is collected sequentially over time.
Tells you when, not why
SPC tells you if and when something has happened, but not why it happened. If you have a signal of special cause you, will have to investigate the process for the probable cause.
An industry example of SPC
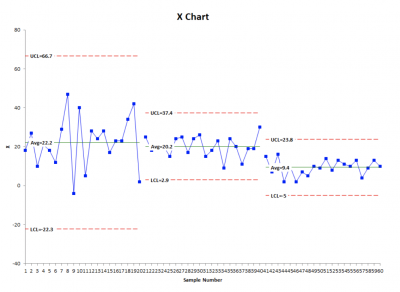
The director of IT was concerned with the increase in computer crashes occurring in the company. Since he had been trained as a Lean Six Sigma Green Belt, he decided to use SPC and control chart the computer crashes.
Below is a series of control charts he made. The first shows the current state when he started the project. The second chart shows he was able to reduce the variation of crash frequency. The last chart shows how he was able to reduce the total number of crashes. He continued to monitor to be sure the process did not deteriorate.
3 best practices when thinking about SPC
SPC is a powerful tool for managing your process. It can also be misapplied. Here are some hints to keep you from misusing SPC.
1. Don’t control chart everything that moves
You can overwhelm your organization by control charting too many variables. Determine what your key variables are, and focus on those.
2. Engage the people doing the work
SPC is intended to help people manage their processes better. Imposing it on them could cause resistance and a reluctance to use control charts. If possible, let the people doing the work do their own control charts.
3. Don’t use SPC as a punishment
If you want honest reporting of how the process is working, don’t weaponize the control chart to punish people. Remember, SPC is used for monitoring and improving the process, not for punitive purposes.
Frequently Asked Questions (FAQ) about SPC
When was SPC developed, and by whom?
Dr. Walter A. Shewhart of Bell Laboratories first developed the concept of SPC and control charts in the 1920s. Dr. W. Edwards Deming expanded on the concept of SPC and taught it to the Japanese after World War II.
Can I use SPC in non-manufacturing functions?
Yes. As long as you have sequentially collected data, you can use SPC and control charts to monitor and improve your processes.
Will SPC tell me why I have special cause variation?
SPC and control charts signal whether and when you have common or special cause variation. If you have special cause variation, SPC does not tell you why; you will have to investigate.
Some final thoughts on SPC
SPC and control charts are a powerful tool for monitoring your process and determining whether it is exhibiting common or special cause variation.
If it’s common cause, look to improve your process by moving the average in the appropriate direction and reducing the variation for better predictability and output consistency. If it’s special cause, investigate, and either incorporate if the cause made the process better or eliminate if it made things worse.