
Is there a simple graphical tool for looking at a series of linked hierarchical activities? Yes, a tree diagram would be a good one to use. Let’s see how it would work.
If you have a series of hierarchical tasks and subtasks to complete before you reach some objective, then a tree diagram would allow you to graphically view these tasks along with the probability associated with each task.
Overview: What is a tree diagram?
A tree diagram is composed of three elements. They are:
- Nodes – Each node represents a certain task.
- Branches – A branch connects two nodes. Each node can have several branches.
- Probabilities – The probability of each outcome is written on its corresponding branch.
The rule for finding the probability of the occurrence of a particular event in a tree diagram is to multiply the probabilities of the corresponding branches.
Another way to describe the construction of a tree diagram is:
- Root Nodes – the foundations from which the structure evolves, it is the starting point.
- Nodes – points that emerge from the root nodes. They are connected to the root with connecting lines called links or branches. It shows the relationship between the elements of the structure.
- Leaf Nodes – referred to as end nodes since nothing branches out from them.
There are generally two types of event probabilities represented within tree diagrams. They are:
- Conditional probabilities – known as dependent events. A conditional probability is the increased chances of an event taking place because another event has already happened.
- Independent events – Independent events have no effect on the occurrence or probability of other events. Their probability of occurrence is not dependent on or influenced by the occurrence of other events.
An industry example of a tree diagram
The events manager was trying to plan for an employee recognition event. She gathered information about the weather predictions for the day of the event. She decided to construct a tree diagram to help her decide whether to plan the event outdoors or indoors. Here was her tree diagram:
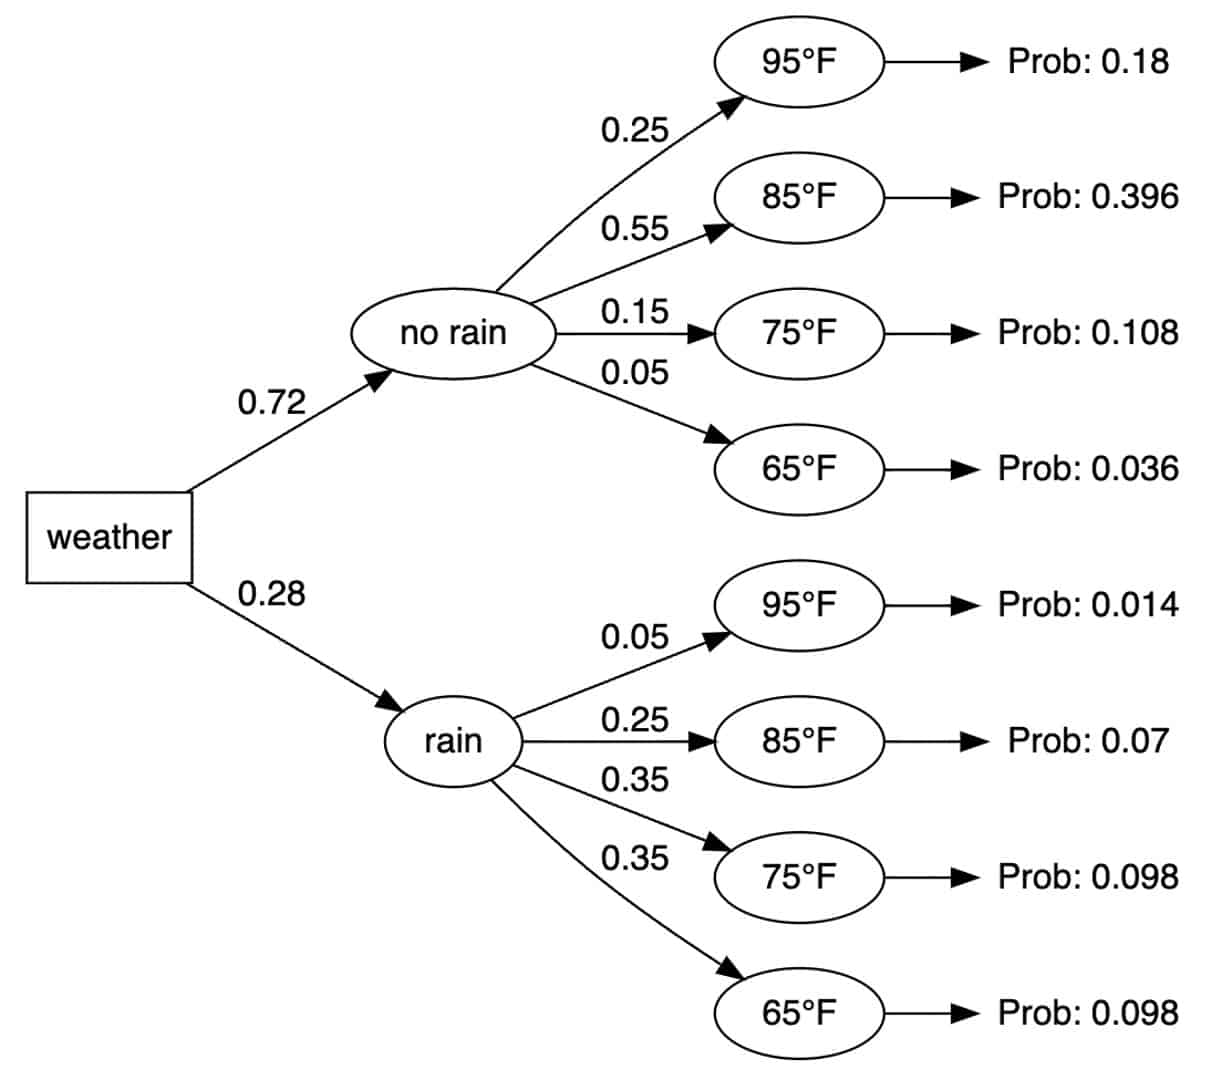
Based on the above probabilities, she decided on holding the event outdoors because the probability of no rain and 85 degrees was the highest. This was calculated by multiplying the 72% probability of no rain times the 55% probability of a temperature of 85 degrees (.72 x .55 = .396).
Frequently Asked Questions (FAQ) about a tree diagram
How do you use a tree diagram to find probabilities?
To use a tree diagram to find probabilities of an outcome you should do this:
- Fill in the probabilities on the branches.
- Consider which outcomes are needed to answer your question.
- Find the probability of those outcomes by multiplying along the branches.
- Use the probability/probabilities you have calculated to answer your question.
What is a tree diagram used for in Six Sigma?
A Tree Diagram is a chart that begins with an initial condition or event and then branches into more detailed sub-events and keeps branching until you exhaust the possible sub-events. It moves from the general to the more specific in a systematic way. It also allows for the probability of the chain of events by using the probability of each sub-event.
Is a tree diagram different from a process flow chart?
Yes. A tree diagram is different from a flow chart because flowcharts are used to describe the tasks involved in a process, which might include multiple decisions. A tree diagram starts with a single issue and then branches off from the initial issue.