
An important aspect of Lean Six Sigma deployments is determining which process improvements to pursue in order to achieve business objectives. Project identification, scoping, chartering and sequencing are key elements that help guide such decisions and lead a company toward world-class quality, effectiveness and efficiency.
Common process improvements include lead time reduction projects. For these initiatives, tools, such as a project prioritization matrix and critical path analysis of the overall timeline, are useful methods for visualizing which subprocesses impact the overall lead time. Therefore, they enable businesses to make the right decisions on where to apply resources first to achieve measurable improvements.
Creating a Project Prioritization Matrix
A well-established method to identify process improvement opportunities begins with process-mapping sessions. In these sessions, participants map the current-state activities of important business processes that need improvement. They then identify process activities where opportunities exist to improve quality, total lead time or resource/effort levels. The output from these initial exploratory sessions is a list of potential project concepts. Those concepts then can be assessed using a project prioritization matrix to establish which areas to pursue further and in what order.
The project prioritization matrix is a graphical display of a ranked effort-and-benefit assessment for each identified improvement concept. The levels of effort and benefit for each project can be generated and combined into a net ranking of high, medium or low for placement on the prioritization matrix. The desirability regions of the prioritization matrix provide clear visuals for which improvement concepts should progress to the next stage of project chartering and launching.
Right-sizing the Project
The priority matrix provides a good visual aid, showing high-benefit concepts; however, some of these concepts may need to be refined in size. An important aspect of “right sizing” a project scope is to aim for results within six months in order for the business to see timely improvement and return on investment on the project team’s time and effort. Concepts that appear to require a long time to resolve may lead a team to further dissect and parcel the concept and transform it into a series of connected smaller projects delivering incremental benefits sooner. These smaller projects can be managed as a program to achieve the net benefit originally outlined. The key objective is to obtain timely results for the business.
For lead-time improvement projects that involve large, complex, multi-department parallel activities, it is easy to establish overall benefit, but often difficult to discern how to right-size projects and assess what smaller scope to select that will lead to measurable benefit. A useful approach is to perform a critical path analysis of events that together make up the overall lead time.
Performing Critical Path Analysis
A critical path analysis reviews a series of events or tasks in terms of start dates and end dates, as well as interdependencies among such tasks. The critical path is the particular path within this mesh of events that can account for the final overall lead time. Events or tasks not on the critical path have what is called float time, whereby they could have happened slightly earlier or later and the overall lead time would not have changed. It is important to identify project opportunities on the critical path in order to reduce the overall lead time. Project opportunities in process areas not on the critical path will reduce the duration of the subprocess, but result in increased float time rather than impacting total lead time.
Method
A baseline of past activities and outcomes should contain the following three elements of information:
- A list of all activities required to complete the overall outcome
- The start and end time of each activity
- The dependencies between the activities

Consider the example of a department receiving a package of inputs at various points in time, carrying out activities and delivering a package of outputs where the final output element defines the total lead time of the associated process. The example is displayed graphically in Figure 2, in Gantt chart style.
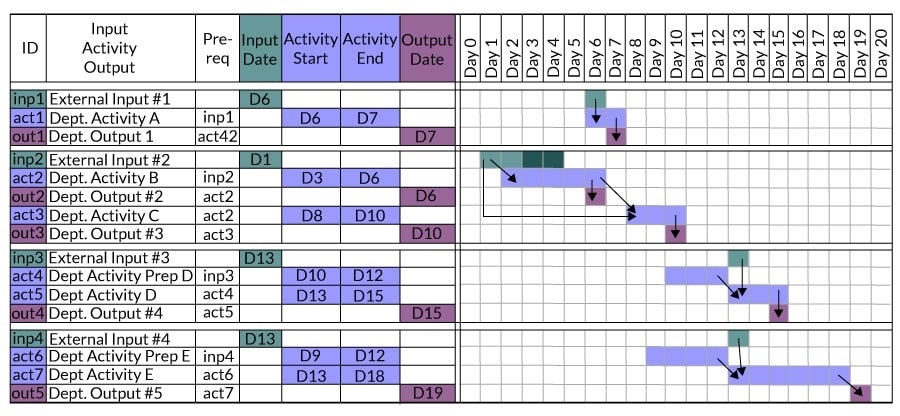
A color-coded legend indicates which events are driven from outside the scope of control of a particular department (green), the departmental activities (blue) and the final outcomes/outputs (purple). The arrows indicate interdependencies, where an event has to begin or conclude before another event can begin or conclude.
A critical path analysis is carried out by starting at the last output and tracing the upstream path of prerequisite events, then moving to the immediately preceding output and repeating the upstream path (Figure 3). For this example, the critical path is shown in red. Events not on the critical path have the ability to float. It is important to be aware of these float activities as it may be an indicator that resources could be shifted to critical path items to manage the overall timeline.

Drawing Conclusions from the Path
This example illustrates how to use critical path analysis to guide project prioritization to effect overall lead time. The suggested priorities are illustrated in the table below.
| Improvement Opportunities | ||
| Critical Path | Charter External to Department | Charter Within Department |
| inp2 | Reduce lead time of completing inp2 | |
| act2 | Reduce lead time of completing act2 | |
| act3 | Reduce lead time of completing act3 | |
| inp4 | Reduce lead time of completing inp4 | |
| act7 | Reduce lead time of completing act7 | |
There is some risk with this approach if a change of events causes a change in the critical path. For example, changes in resource allocation could affect departmental timing, the duration of activities or different timing of an incoming event. This would result in the identified improvement projects enabling more float in that subprocess rather than having immediate impact on the overall lead time.
Driving Business Results
In this example a critical path analysis has allowed the business to narrow improvement opportunities from potential projects on four inputs plus seven activities, or 11 total project opportunities, to five opportunities, effectively achieving a 55 percent narrowing of initiatives. This will knowingly impact the immediate business objective of total lead time reduction.
Critical path analysis offers a useful approach and rationale for prioritizing improvement opportunities within a complex process space. On a journey of continuous improvement, every subprocess improvement is a valid exercise. The right projects, selected through critical path analysis, add up to demonstrable business improvements to total overall lead time.