
Testing for normality is often the first step in analyzing your data. Many statistical tools that you might use have normality as an underlying assumption. If you fail that assumption, you may need to use a different statistical tool or approach. This article will explore what the normality of the data means and the variety of normality tests that you can use. We will also explain the benefits of testing for normality and offer a few best practices for understanding when and how to do a normality test.
Overview: What Is a Normality Test?
As the name suggests, it is a test for the normality of your data. But, what does that mean? Normality refers to a specific statistical distribution called a normal distribution, or sometimes the Gaussian distribution or bell-shaped curve. The normal distribution is a symmetrical continuous distribution defined by the mean and standard deviation of the data.
Its formula is:
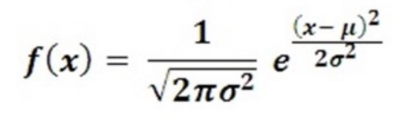
Regardless of the mean and standard deviation, the shape of the normal distribution will always be the same. The key characteristic is the distribution of the data under the curve. Note in the graphic below, you will see the percentage distribution that will be defined by adding and subtracting the value of 1, 2, or 3 standard deviations to/from the mean or average of the data.
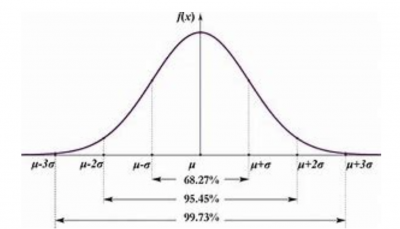
Image source: eajohansson.
Defining Normality in Data
The normal distribution is theoretical. What you are testing with the normality test is not whether your data is exactly consistent with a normal distribution, but whether your data is close enough to normal that you can use your statistical tool without concern. In some cases, a statistical tool may be robust to the normality assumption, so you may be able to use it without worrying about whether your data is normal or not. In other words, the normality test is not overly sensitive to some level of violation of the normality assumption.
The normal distribution is popular because it describes many real-life situations, such as the distribution of people’s heights, weights, and income. In summary, here are the properties of the normal distribution:
- Bell-shaped
- Symmetrical
- Unimodal — it has one “peak”
- Mean and median are equal; both are located at the center of the distribution
- About 68% of data falls within +/- one standard deviation of the mean
- About 95% of data falls within +/- two standard deviations of the mean
- About 99.7% of data falls within +/- three standard deviations of the mean
Now that you understand what a normal distribution is and why you need to do a normality test, let’s look at some of the more common tests.
Testing for Normality
The simplest way you can test for normality is to do a normal probability plot. The plots below are the output of a popular statistical software. You would interpret this graph by looking at the line and the confidence interval.
- Normal: If the line is relatively straight and falls between the outer blue lines, you would say the data is not different from a normal distribution.
- Not normal: If the line is not straight and falls outside of the blue lines, you would conclude that the data is not normal.
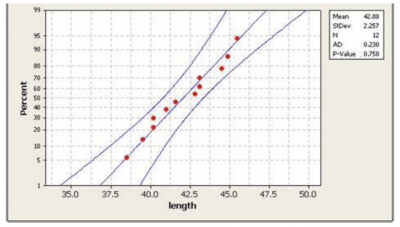
Image source: Stack Overflow.
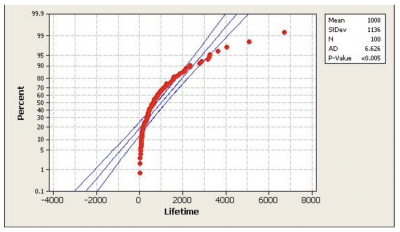
Image source: Dr. Glyn George.
The normality test is a hypothesis test. The null hypothesis (Ho) is that your data is not different from normal. Your alternate or alternative hypothesis (Ha) is that your data is different from normal. Regardless of the statistical normality test you use, you will make your decision about whether to reject or not reject the null based on your p-value.
There are several statistical tests you can use. Two of the most popular are the Anderson-Darling Test and the Kolmogorov-Smirnov Test. The null and alternate hypotheses are the same as described above.
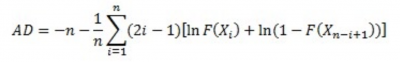
The test statistic for the Anderson-Darling test is:
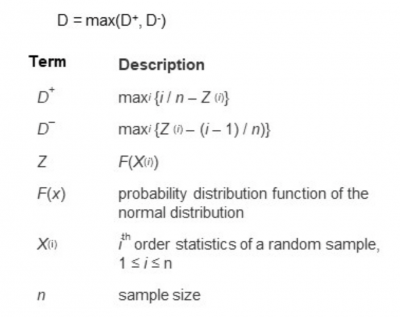
The test statistic for the Kolmogorov-Smirnov test is:
In both cases, the output you get will include a p-value. Assuming that you selected your alpha value to be 0.05, you will reject the null if the p-value is less than 0.05. That allows you to claim that your data is statistically different from a normal distribution. On the other hand, if your p-value is higher than 0.05, you can state that your data is not statistically different from a normal distribution.
Benefits of a Normality Test
Knowing the underlying distribution of your data is important so you can apply the most appropriate statistical tools for your analysis.
It Confirms Your Distribution
A normality test will help you determine whether your data isn’t normal rather than tell you it is normal.
Provides Guidance
By properly reacting to the p-value, you’ll know whether you’ve complied with the underlying assumption of your statistical tool and whether you can proceed with your analysis.
Can Be Simple
Many times, you can use a graphical tool such as a histogram or probability plot to visually determine if the data looks like it might be normal.
While it’s only a rough approximation, if you see a bell-shaped, symmetrical picture on a histogram, it might be sufficient. If the probability plot looks straight and is within the lines of the confidence interval, you might be OK in assuming the data is not different than normal — especially if the statistical test you’re using is robust to the assumption of normality.
Why Is the Normality Test Important to Understand?
Different statistical tools for analysis have different assumptions regarding the underlying distribution of the data that you are analyzing.
Know Your Tools
Understanding how these tools factor into your analysis is crucial, after all, you don’t grab the first thing you find in your toolbox when you need to fasten a screw. Taking the time to learn the tools and tests most commonly used for normal data helps give sold results that are actionable.
For example, the t-test has an assumption that the data is normally distributed. Linear regression assumes that the underlying distribution of the residuals is normal. Binary logistic regression has an assumption of the binomial distribution. Others might have an assumption of the F or Chi-Square distributions.
You need to understand what these assumptions are regarding your data.
What Is Your Hypothesis Test?
Since the normality test is a form of hypothesis testing, you want to correctly state your null and alternative or alternate hypotheses. In the case of the normality test, the null is that your data is not different from a normal distribution. This is what you would want since it is the underlying distribution for your desired statistical tool. The alternate is that it is different from the normal distribution.
Acknowledge the Impact of Sample Size
As the sample size of your data increases, your chances of discovering non-normality increases. Small sample sizes may give you a false reading of normality.
Understanding the p-value
The p-value of your normality test will indicate, with your desired level of risk, whether you can reject your null hypothesis. You must know what that means so the next action you take is appropriate.
An Industry Example of Using the Normality Test
One of the most common statistical analyses used in a business environment is linear regression. This tool allows you to determine the relationship between an X or input variable and a Y or output variable. A typical question you might ask would be, “Is there a relationship between run speed and temperature on your manufacturing line?”
A manufacturing engineer gathered data and, using a common statistical package, did the calculations for the linear regression. He was very pleased when the results showed that the r-squared value was 0.86. This means 86% of the variation of the Y, or output variable, can be explained by the relationship with the X, or input variable. That is a very strong relationship.
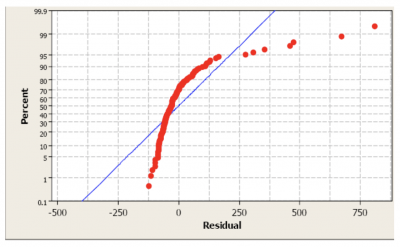
Fortunately, the LSS Black Belt assigned to manufacturing reviewed the analysis before the engineer communicated it to his manager. One of the assumptions of linear regression is that the residuals are normally distributed. When asked, the engineer admitted that he had failed to check that. When he did, he found that the residuals were very different from normal. This is often a result of some questionable data or data collection methods.
This was his probability plot:
Best Practices When Thinking About a Normality Test
It’s unlikely that you’ll do the hand calculations for a normality test. The important issue will be how you collect the data and interpret the results of your normality test. Here are a few thoughts to keep in mind.
Plot the data
Often, a simple plot of the data on either a histogram or probability plot will provide you with enough insight into how your data looks. This will keep you from having to do more complicated analysis.
Sampling
Random sampling of adequate size will increase the chance that your normality test will accurately reflect the true nature of the underlying distribution.
Plan B
Your data may not be normal, so have a Plan B, or alternate analytical tool, that will still answer your statistical question but doesn’t have the same underlying assumptions of the data distribution.
Other Tools for Your Data
Testing for normality isn’t going to be the only thing you do with your data, of course. As such, there are some other concepts you might want to brush up on to make the most of your analysis. We’ve discussed normality at length, so understanding how x-bar plays into your statistics is key.
Further, you might want to learn about how to test standard deviations across multiple data points. For that, you’ll need pooled standard deviations, which we cover in a fairly comprehensive guide. Both of these concepts work hand in hand with normality tests.
Wrapping Up the Normality Test
Many statistical tools have an assumption that your data is approximately normally distributed. If it is not, then you must use a different tool to answer your statistical question. The normality test starts with a null statement that your data is not statistically different than normal. The alternate statement is that it is different from normal.
Either using some simple graphical tools or more advanced statistical tools like the Anderson-Darling or Kolmogorov-Smirnov Tests, you will get a result that will suggest that you can reject the null, or you must fail to reject the null. From there, you can decide how to proceed.