
In the Analyze phase of DMAIC, you will want to identify possible independent or predictor variables to help explain the relationship with your response or dependent variables. Correlation is a statistical tool to establish the strength of the relationship between your independent and dependent variables. Regression is used to predict your response variable as a function of that relationship.
Overview: Regression
It is an accepted concept that the output of your process is dependent upon the quality of your process inputs. Regression is a statistical tool which allows you to predict, with varying degrees of accuracy, your output based on the values of your input.
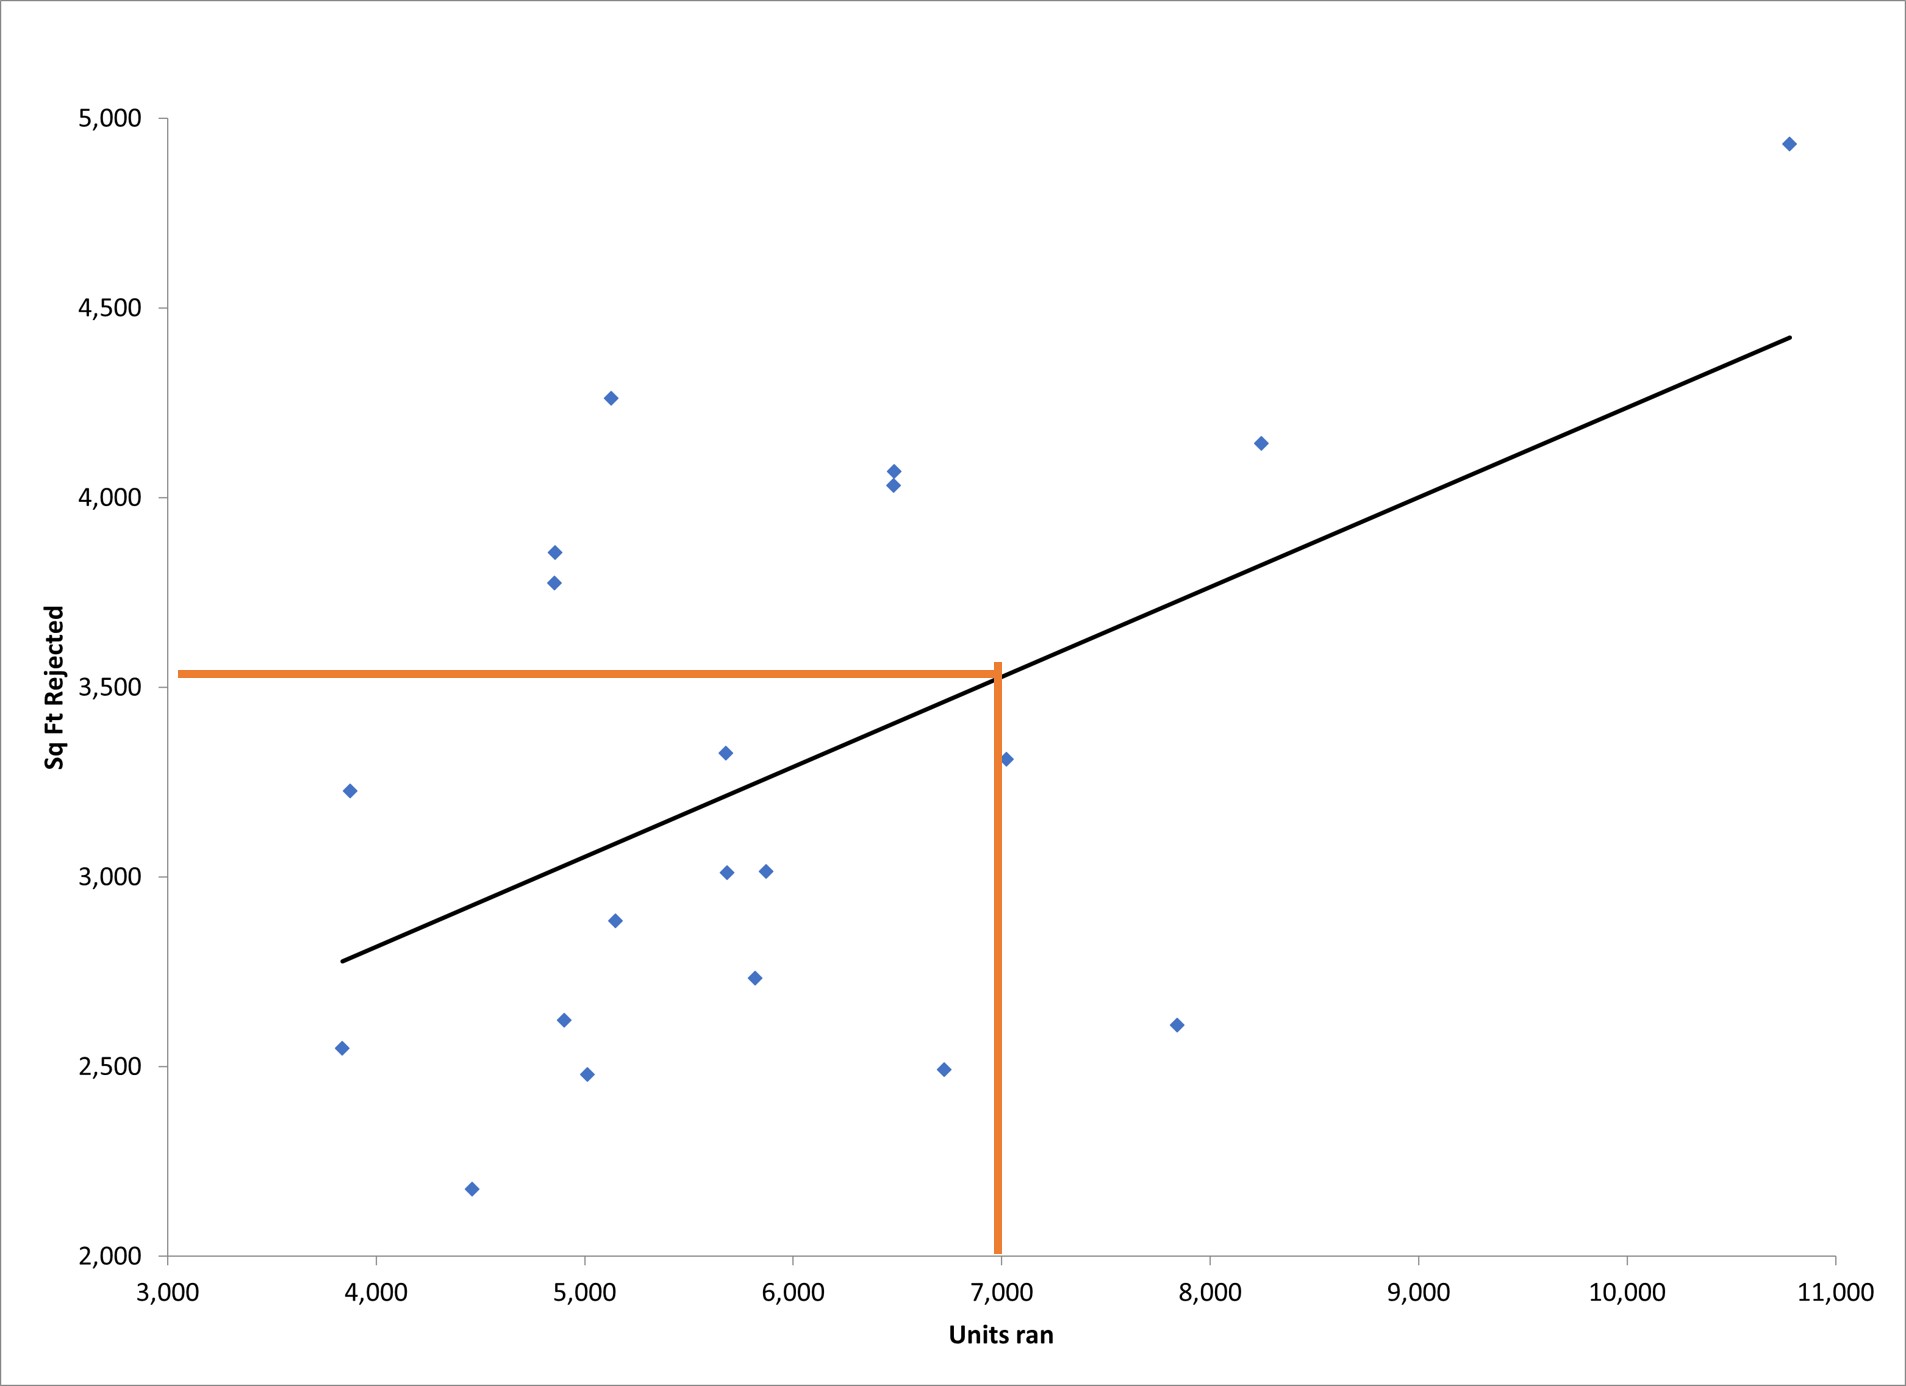
You can visually represent the relationship using a Scatter Plot. A simple example of using one dependent and one independent variable is shown below. Start by finding the value of the independent variable on the X axis, reading up to the line and then across to the Y axis, will give you the predicted value for your dependent variable.
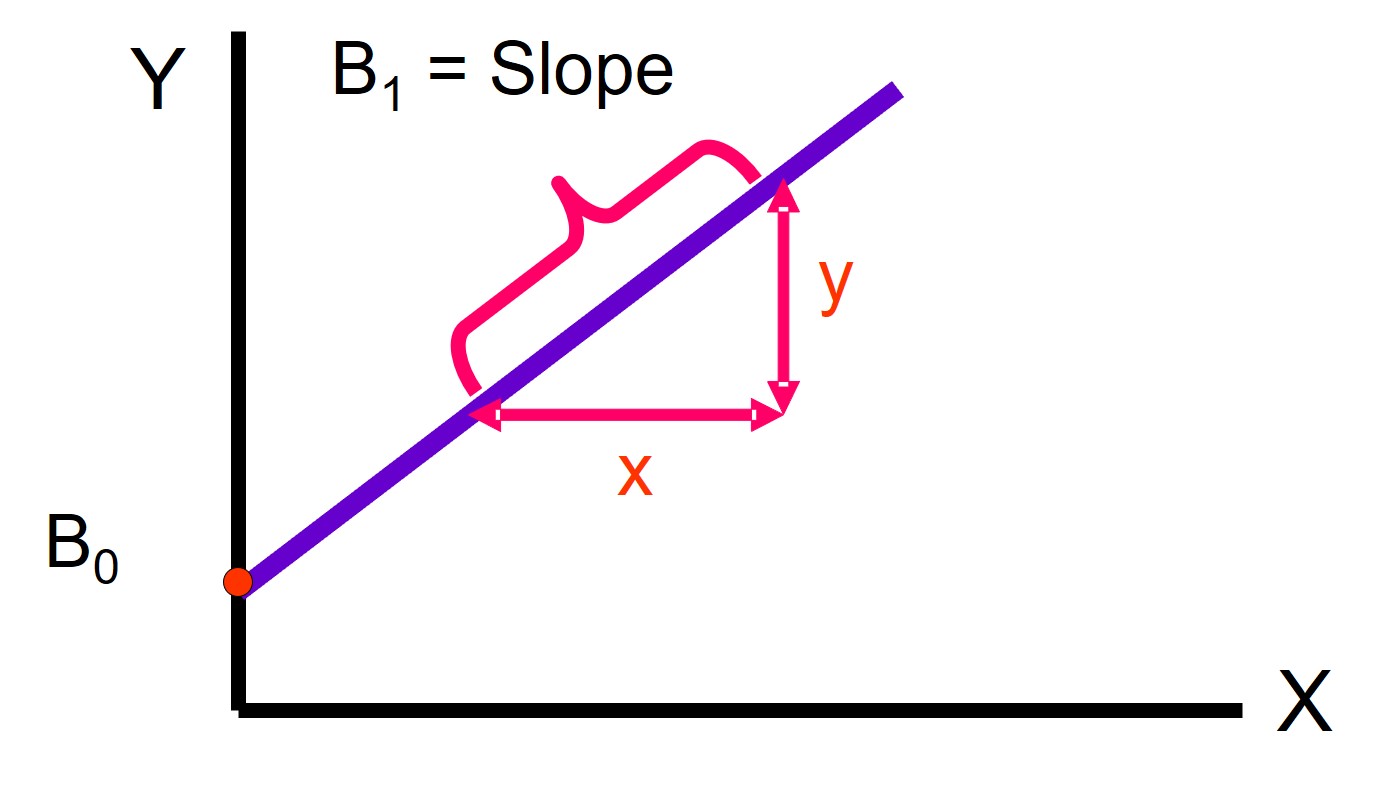
This can also be expressed as a mathematical formula of Y = B0 + (B1*X) where the Bs represent the Y intercept when the value of X is zero and the slope of the line respectively. This is shown below.
Four of the most common types of regression are:
- Simple Linear Regression – prediction is based on a linear relationship between one X and one Y variable where both are continuous data
- Multiple Linear Regression – prediction is based on a linear relationship between multiple X variables and one Y variable where both are continuous data
- Polynomial Regression – prediction is based on a non-linear relationship between one X and Y variable where both are continuous data
- Logistic Regression – the Y variable is discrete data with its value being typically binary in nature such as 0 or 1, yes or no, etc. Prediction is not an actual value but the probability of the outcome
An industry example of regression
The Six Sigma Black Belt (BB) was interested in the relationship between the sales of one of the company’s major products and the amount of money spent on advertising. She decided to first do correlation to see how strong the relationship might be. The relationship turned out to be strong.
She then used simple linear regression to predict potential sales if the company spent $250,000 in advertising. The predicted sales were a sufficient multiple of the advertising spend, so the company decided to run the new advertisements.
Frequently Asked Questions (FAQ) about regression
What is regression used for?
It is used to predict the value of a response or Y variable for a specific value of a predictor or X variable.
What is the difference between correlation and regression?
Correlation shows the strength of the relationship between X and Y variables while regression develops a prediction model of the relationship where the Y variable can be predicted using specific values for the X variable.
Must the regression equation always be based upon a linear relationship?
No. Your regression model can also be developed for a non-linear or polynomial relationship.
Must I always use continuous X and Y variables for my regression?
No. If your Y variable is discrete data such as Yes or No, you can use logistic regression to predict the probability of your Y value occurring.