
If all your process measurements were the same, you would be suspicious something is going on in your process. You know your process variation can be caused by the inherent variation in your process people, methods, equipment, materials, etc. Let’s examine the concept of variation and how it impacts your process and your decisions.
Overview: What is variation?
In statistics, variation is a measure of the dispersion or spread of your process data. Because of the natural variation in your process components, you expect your overall process data to vary. The term variation is found throughout statistics and Six Sigma. Here is a list of how you can measure variation:
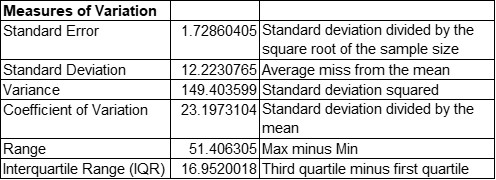
- Range – the difference between the highest and lowest values in a set of data
- Standard deviation – the average distance between all the data points and the mean of your data set
- Variance – the standard deviation squared
- Interquartile range (IQR) – the difference between the value of the first and third quartiles of your data set
You may also see the phrases within sample variation and between sample variation. Within sample variation, also referred to as noise, is the variation or dispersion of your data in a sample or subgroup. Between sample variation, also known as signal, is the variation over time between subgroup means.
In the context of control charts, your within sample variation is measured by the range or R chart. Between sample variation will be measured on the average or Xbar chart. Control charts are used to distinguish between common and special cause variation.
An industry example of variation
Below is the output of variation measurements from a statistical software package:
Frequently Asked Questions (FAQ) about variation
What is the disadvantage of using range as a measure of variation?
The range measures the difference between the highest and lowest values in a data set. It tells you nothing about the distribution or dispersion of the rest of the data.
Should I just use the average to describe my set of data?
No. The average is a measure of the central tendency of your data. Without a corresponding measure of variation, you don’t get a complete view of your data. Two data sets may have the same average but different measures of variation. It is often said that your customers don’t feel the average, they feel the variation. That is why Jack Welch, former CEO of General Electric, was fond of saying “variation is evil”.
What can cause variation in my process?
Your process variation can be caused by:
- variation in people who work in your process
- variation in your raw materials
- variation in how your equipment functions
- variation in how people perform the tasks in the process
- variation in environmental conditions
- variation in how people take measurements