Control Chart Suggestion
p-Chart
Control Chart Description
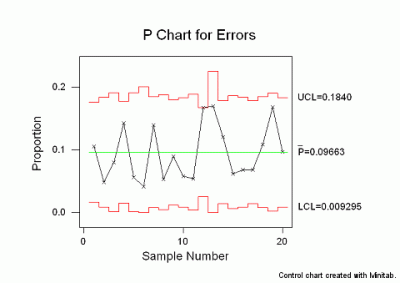
Control charts dealing with the proportion or fraction of defective product are called p charts (for proportion). There is a difference between a defect and defective, as there is between a nonconformity and nonconforming unit. The p-chart control chart is used with discrete/attribute defective data when the sample size is greater than 50. The sample size may vary.
Control Chart Formulae

Control Chart Example
