
Regardless of what kind of Six Sigma project you are starting, you will want to get a baseline of the current as-is condition. Knowing where you started and comparing it to where you ended up will let you know if your improvement activities resulted in any change.
Overview: What is a baseline?
A baseline is merely a defined starting point for some activity, whether it be for a Six Sigma project, diet, blood pressure, or the time you take to run one mile. By having a baseline, you can see if your efforts resulted in any changes or improvements.
In Six Sigma, there are a number of applications where you can establish your baseline, monitor it over time, and then compare your baseline to some ending point. Some of the more common applications for calculating baselines for later comparison are:
- DPMO – Determine improvements in sigma level.
- Process capability or Cpk — Know if your process is better at meeting your customers’ specifications.
- Rolled throughput yield (RTY) – Judge whether you have increased the efficiency and yield of your process.
- Control charts – Monitor whether your process has shifted over time.
An industry example of a baseline
The Black Belt (BB) of a medium-sized manufacturer was interested in knowing whether one of the Six Sigma projects he was working on was actually achieving his desired goal. Prior to starting the project, he collected some baseline data on a key manufacturing metric. After his project was completed, he wanted to compare his baseline data to his final data.
Since his metric measurement was variable data, the BB chose to use a control chart to measure his process accuracy and variation, and Cpk to compare his process capability.
Below are his baseline and final charts and calculations. You can see there was an improvement over the baseline.
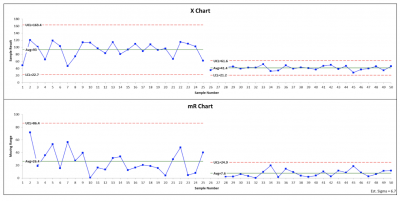
The first 25 data points represent the baseline data. You can see the average of the second 25 data points had a significant drop at point 26, which is where a change was made. You can also see a significant decline in the variation of the data. A reduction in both average and variation were the desired outcomes for this project.
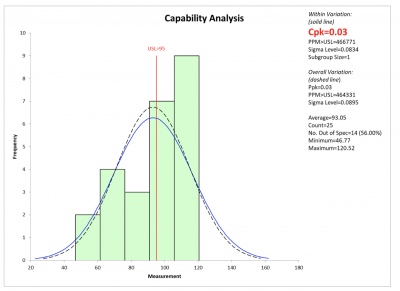
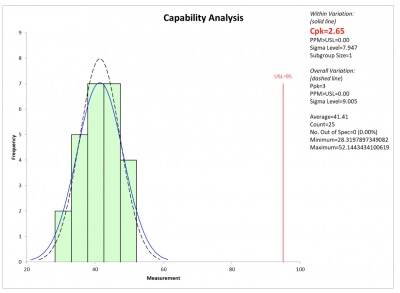
The process capability of the baseline data is shown below as well as the final outcome after the process change. The improvement in Cpk (higher) reinforces the conclusion that there was process improvement over the baseline.
Frequently Asked Questions (FAQ) about a baseline
1. Should I always collect baseline data before starting my Six Sigma project?
Yes, if you have reliable current or historical data. Once you complete your project, you will have data of your after condition. By comparing your after data with your before data, you will be able to assess how successful you were in improving your process.
2. What is a simple definition of baseline?
In the context of Six Sigma, it is the starting point of your current as-is condition. You will compare your baseline to your final ending point to determine how much change occurred as a result of your improvement efforts.
3. What are some Six Sigma tools to compare the before and after of my project?
A control chart is a powerful tool to visualize your change over time. By looking at the data before your project starts and comparing it to your data after your project is completed, you will be able to visually see the impact of your team’s efforts.
Hypothesis testing is another powerful statistical tool for comparing before and after conditions. A 2-sample t test can be used to determine whether there was a statistically significant change from before your project began to after your project was completed.