
Because of variation in the data we use for analysis, point estimates are often not reliable enough. That is why it is necessary to account for that variation by using a confidence band, prediction band or confidence interval.
Overview: What is a confidence band?
A confidence band is like a confidence interval. A confidence interval is defined as a plausible range of values for your population parameter based on taking your sample point estimate and adding and subtracting a margin of error. It is used for computing a range of single value estimates.
On the other hand, a confidence band is the lines on a probability plot or fitted line plot which show the upper and lower confidence bounds for all points on a fitted line within the range of data. In regression, at some desired level of confidence, the confidence band will show the plausible range of values for the fitted line. A prediction band can also be computed to show the range of likely values for new observations at some level of desired confidence.
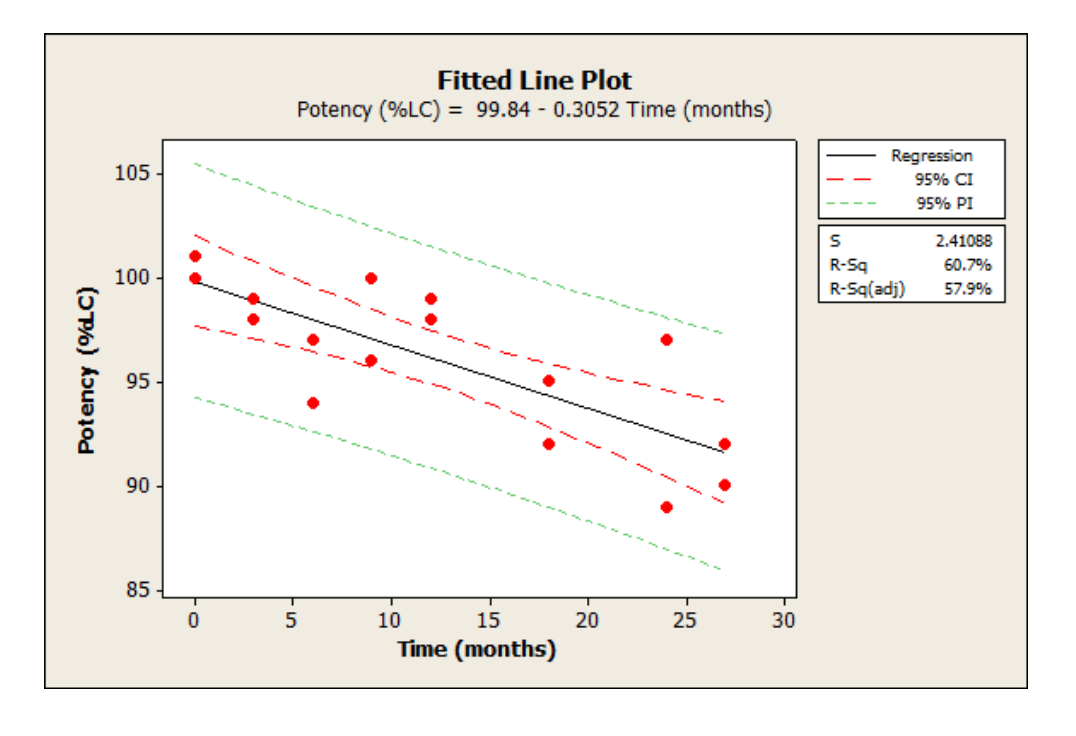
The confidence bands above and below the fitted line represent confidence intervals for the mean response for some predictor variable. In the example below, the model indicates that with a 95% confidence level a density of 15 will generate a mean stiffness between approximately 28 and 35, which are the y-values of the lower and upper confidence bands at X = 15.

An industry example of a confidence band
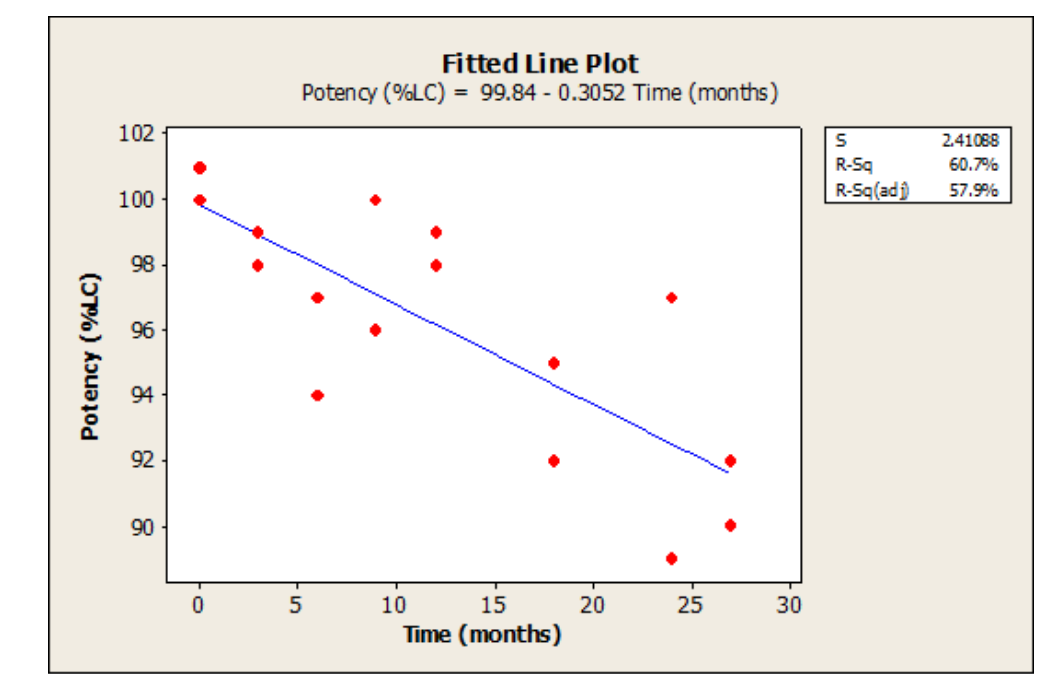
A Six Sigma Master Black Belt (MBB) was assigned to the quality lab to participate in a project seeking to understand the relationship between time and product potency. The MBB did the usual regression analysis as shown below. She then added the confidence and prediction bands to get more insight into the relationship and implications for future data.
The graph below shows the original fitted line plot with the addition of the confidence band (red) and prediction band (green).
Frequently Asked Questions (FAQ) about a confidence band
What is the difference between a confidence band and a prediction band in regression?
The confidence band shows the range of plausible values for the fitted line at some specified confidence level. The prediction band indicates the range of plausible values for new observations at a specified confidence level.
Is there a difference between a confidence interval and confidence band?
Yes, although it may get confusing since both terms are often used interchangeably. The confidence interval is primarily used in sampling and is related to the plausible values for the population parameters. A confidence band is used in regression and indicates the possible range of values for the fitted regression line.
What is a confidence band?
A confidence band is used to represent the uncertainty in an estimate of a curve or function based on limited data. Similarly, a prediction band is used to represent the uncertainty about the value of a new data-point on the curve. Confidence and prediction bands are often used in regression analysis as part of the graphical output of results.