If you plot your data on a histogram, the resulting graphic will illustrate how your data is distributed. This distribution can provide a lot of information about your data and the process from which it came from. Let’s learn some more about distributions.
Once you have collected your desired data, you can display the data in graphical form using a histogram. A statistical distribution is a function that describes the probability of different outcomes in a sample space. It is a way of organizing, presenting, and summarizing the pattern of variation in your data set.
A distribution can be characterized by its shape, center, and spread. In probability theory and statistics, a distribution can be described using various parameters, such as mean, variance, standard deviation, skewness, and kurtosis.
Overview: What is a distribution?
There are many types of statistical distributions, but some of the most used ones include:
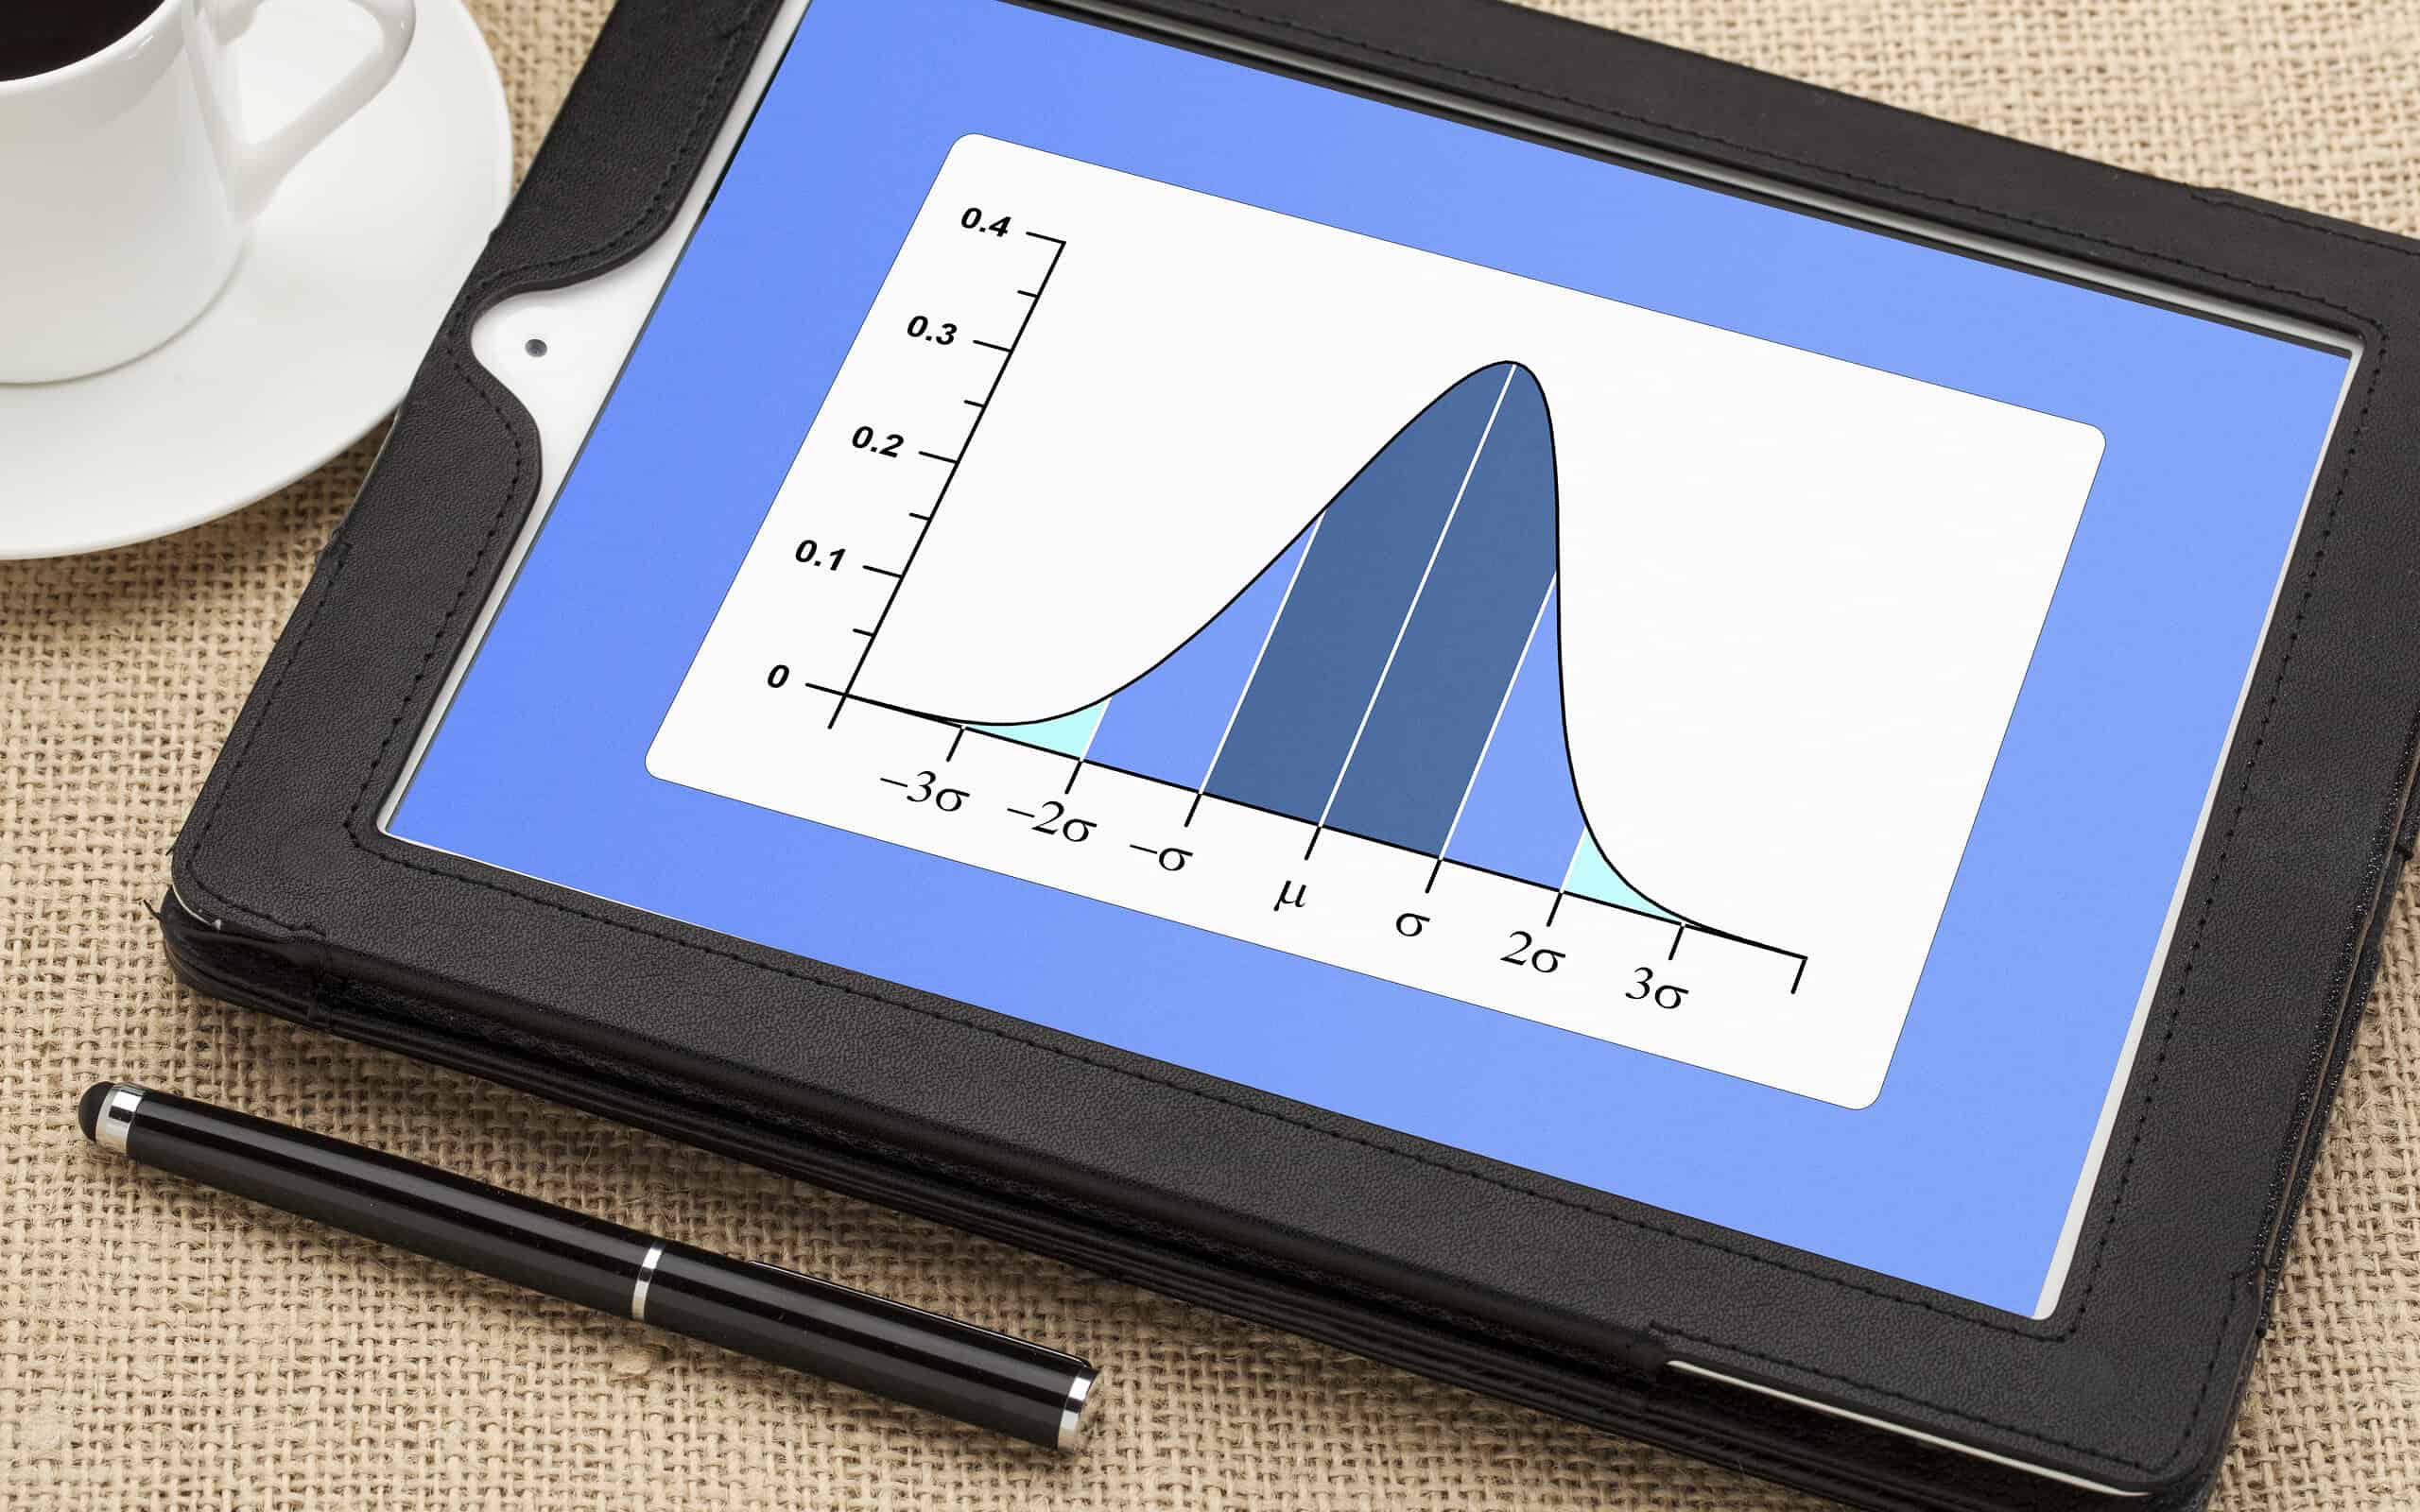
- Normal Distribution – Also known as the Gaussian distribution, this is a bell-shaped distribution that is often used to model continuous data that is approximately symmetric and unimodal.
- Binomial Distribution – This is a discrete data distribution that models the probability of a certain number of successes in a fixed number of independent trials, where each trial has two possible outcomes (success or failure).
- Poisson Distribution – This is a discrete distribution that models the probability of a certain number of events occurring in a fixed interval of time or space, assuming that the events occur independently and at a constant rate.
- Exponential Distribution – This is a continuous data distribution that models the time between consecutive events in a Poisson process.
- Uniform Distribution – This is a continuous distribution that assumes that all values within a certain range are equally likely.
- Chi-Squared Distribution – This is a continuous distribution that is often used in hypothesis testing and goodness-of-fit tests.
- Student’s t-Distribution: This is a continuous distribution that is often used in hypothesis testing when the sample size is small and the population standard deviation is unknown.
Distributions are often described in terms of their density or density functions. Density functions are functions that describe how the proportion of data or likelihood of the proportion of data can change over the range of the distribution.
The two types of density functions are probability density functions and cumulative density functions. They are defined as:
- Probability Density function – calculates the probability of observing a given value.
- Cumulative Density function – calculates the probability of an observation equal or less than a value.
An industry example of a distribution
After collecting some process data, the Six Sigma Black Belt wanted to determine the type of distribution that would most accurately define the data. Below is a histogram and some common statistics as well as the output from trying to fit a distribution. As you can see, the exponential has the highest p-value and therefore best describes the specific data that was collected.
Frequently Asked Questions (FAQ) about a distribution
Here are some frequently asked questions about statistical distributions:
What is a statistical distribution?
A statistical distribution is a function that describes the probability of different outcomes in a sample space.
What is the difference between a population distribution and a sample distribution?
A population distribution describes the distribution of a variable in an entire population, while a sample distribution describes the distribution of the same variable in a sample from that population.
What are some common types of distributions?
Some common types of distributions include the normal distribution, binomial distribution, Poisson distribution, and exponential distribution.
How do you determine the shape of a distribution?
The shape of a distribution can be determined by examining its skewness and kurtosis. A symmetric distribution has zero skewness and a kurtosis of 3. A distribution with positive skewness has a longer tail on the right side, while a distribution with negative skewness has a longer tail on the left side.
What is the mean and variance of a distribution?
The mean of a distribution is the average value of the data, while the variance is a measure of the spread of the data. The standard deviation is the square root of the variance.
How do you compare two distributions?
Two distributions can be compared by examining their means, variances, skewness, and kurtosis. They can also be compared using hypothesis testing techniques, such as the t-test or ANOVA or Analysis of Variance.