
The purpose of Design of Experiments (DOE) is to run a series of controlled experiments to understand the effect certain factors (Xs) have on a response variable (Y). One effect is called the main effect and evaluates the impact of a single factor. There are also interaction effects, which evaluate the impact of a specific combination of factors.
Let’s get a deeper understanding of interactions, what they mean, and how to use them to optimize your process.
Overview: What is interaction?
Let’s imagine you are seeking to improve the gas mileage on your 2002 SUV. You believe there are three main factors that might have an impact on your miles per gallon (mpg): the octane rating of the gas, the speed you drive, and your tire pressure. You decide to use DOE to find out which factor has the biggest effect so you can reduce your fuel costs. You decide to use a three factor, two level full factorial design.
(Check out these links for a complete explanation of DOE, full factorial DOE and fractional factorial DOE.)
Since you are using three factors (octane, speed, and tire pressure) and two levels (low and high), you will need to run eight different combinations of your three factors. When your experiment is done, you will analyze the results to determine which individual factor has the highest effect on your mpg.
The main effects plot below will help you.
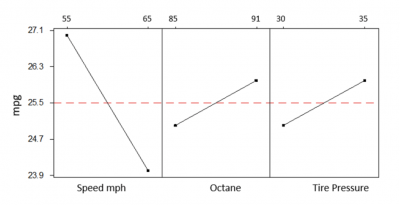
The plot above shows the change in mpg when each factor goes from the low to high level. For example, when you drive 55 mph, and then 65 mph, your mpg goes from almost 27 down to about 24. The same applies to octane and tire pressure.
The slope of the line determines the factor with the highest effect or change in mpg. In this case, your speed is the factor with the most effect since the slope of that line is the steepest.
But, will there be a difference in effect depending on the octane you use? What will be the impact if you drive 55 mpg but use 91 octane? How about if you use 85 octane and have a tire pressure of 35 psi? These questions relate to the concept of interaction. Does the effect of speed depend on octane and tire pressure? If you use 91 octane, what tire pressure should you use?
Comparing the interaction of two factors is called a two-way interaction, and interactions between three factors is called a three-way interaction. Most statisticians agree that two-way interaction is probably the most important to understand.
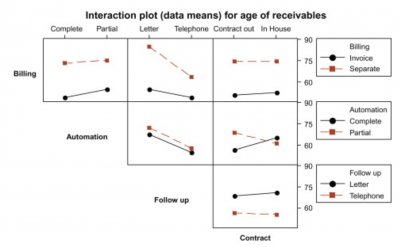
These interactions are shown on an interaction plot: Parallel lines indicate no interaction between the factors. Non parallel or crossed lines will be interpreted as an interaction between the factors.
In the interaction plot below, you will see that some of the interactions are not significant as shown by the parallel lines. Lines that are not parallel or crossed demonstrate an interaction.
2 benefits of understanding interaction
Understanding the interaction between your factors will provide deeper insight into the relationship between your factors and response variables.
1. Uncovers effects between factors that might not be obvious
Sometimes individual factors may not have a main effect, but the interaction between them may be significant.
2. The interaction plot is easily understood
The lines on a two-way interaction plot are either parallel or not. If not, then you have a visual sense of interaction that will need to be statistically validated.
Why is interaction important to understand?
By understanding how interactions work, you will be able to optimize your process better than just knowing about the main effects of your factors.
Statistical significance
Most statistical software will provide a p-value or other statistical indicator of whether your interactions are significant. While an interaction plot is simple to understand, you shouldn’t draw conclusions until you’ve done the statistical analysis.
Tells you more about the impact of your factors
Changes in your response variable can be attributed to either the individual factor effect or the effect of interactions between factors. It is the interaction effects that distinguish a regression analysis from a DOE. Regression doesn’t allow for an easy determination of interaction.
Allows you to remove factors which have no effect
If a factor has no main effect or interaction effect, it can be eliminated from the analysis, thus simplifying your experiment.
An industry example of interaction
An engineer at a computer chip factory decided to do a simple DOE on the relationship between temperature, baking time, and product stability, where higher is better.
This was a simple two-factor, two-level experiment. He was confident the temperature and baking time would have an effect on the response of product stability. He was not sure whether there was an interaction. When the experiment was done, he looked at the interaction plot shown below.
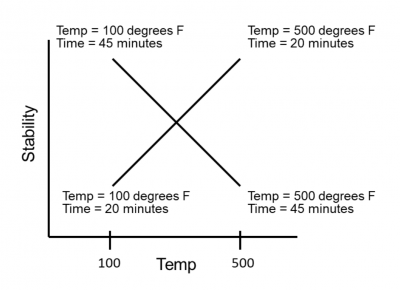
If interaction is defined as when the effect of one factor is dependent upon the setting of another factor, then there appears to be interaction. That is also shown by the crossing lines.
The conclusion he drew was that if he wished to achieve high stability, he needed to bake for 20 minutes if the temperature was set at 500 degrees, or bake for 45 minutes if the baking temperature was lowered to 100 degrees.
3 best practices when thinking about interaction
Here are a few tips for utilizing interactions in your DOE.
1. Think about possible interactions before you do your DOE
Consider possible interactions while selecting the factors you want to use in your DOE. The results of your DOE will either confirm or discard your assumptions.
2. Don’t worry too much beyond two-way interactions
Anything beyond a two-way interaction is difficult to understand. Most of the effect will come from the interaction of two factors.
3. Use graphical plots for main effects and interactions
The plots will give you a quick visual indicator of what you might expect once you’ve done your statistical analysis.
Frequently Asked Questions (FAQ) about interactions
1. What is an interaction in DOE?
An interaction is when the effect of one factor on a response variable depends on the level or settings of another factor.
2. How can you tell if there are interactions between factors?
An interaction plot is the easiest way to see if there are any two-way interactions. If the lines are parallel, then there is no interaction. If the lines cross or are non parallel, there is a high likelihood that interactions exist. This must be confirmed statistically, not just visually.
3. Can I have a three-way interaction?
Yes, you can have multiple interactions depending on the number of factors.
So, what is interaction?
As a result of doing a DOE, you will identify two types of effects or impacts that your factors will have on your response variable. One is the effect a single factor has on the response by itself. This is referred to as a main effect. The other is an interaction effect, which is the effect of that one factor depending on the settings or levels of another factor.
Interaction effects can be visualized on an interaction plot. This consists of a series of lines representing the factors and the response. If the lines are parallel, then there is no interaction between the factors. If crossed or non parallel – and confirmed by statistical analysis – then you can say there is an interaction between the factors.