
While the normal distribution is an assumption of many statistical tools, your data will not always be normal. If your data distribution looks different from the standard normal curve, what does that mean?
Overview: What is a leptokurtic distribution?
One of the key measures used for describing the shape of the normal distribution is kurtosis. In simple terms, kurtosis is a measure of the height of the distribution and the length of the tails relative to that of a normal distribution. The value for kurtosis of a normal distribution is 3, and the shape is referred to as mesokurtic. Kurtosis for a standard normal distribution will be zero.
A distribution defined as leptokurtic will have a kurtosis greater than 3 when compared to a normal distribution and a value above zero in the context of a standard normal distribution.
The center of the curve will be taller than a normal distribution, and the tails will be heavier. Kurtosis refers to the tailedness of the distribution rather than the peakedness. Kurtosis is also called the fourth central moment.
Below is a graph comparing a normal distribution with a leptokurtic one.
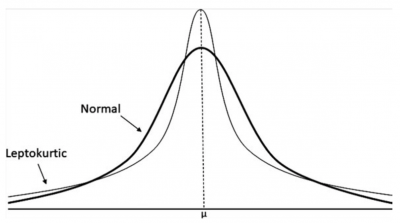
Normal versus leptokurtic curve
An industry example of a leptokurtic distribution
An engineer was reviewing the graphical output of his data. He was hoping the data would be normally distributed so he could easily do his statistical calculations. Unfortunately, the shape of his data was leptokurtic.
His interpretation was that the data had more outliers than a normal distribution due to the wider tails. He was concerned the outliers might impact the validity of his analysis.
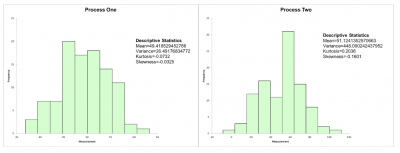
Below is a graph of some normally distributed process data on the left plus a graph of data with a higher kurtosis on the right. Note the height of the leptokurtic graph is taller and the width of the tails wider.
Frequently Asked Questions (FAQ) about a leptokurtic distribution
1. How would you describe a leptokurtic distribution?
A leptokurtic distribution has a higher peak and thinner bell shape. It will also have wider and fatter tails than a normal distribution. A high positive value of kurtosis will indicate the leptokurtic distribution has more of the values located in the tails of the distribution than around the center or average.
2. Where does the term “leptokurtic” come from?
Kurtosis is derived from a transliteration of the Greek word kurtos, meaning curved or arched. Kurtic stems from that. Lepto also comes from Greek and means thin or slender.
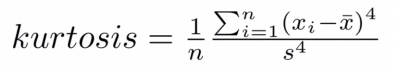
3. What is the formula for kurtosis?
Here is the formula for kurtosis.
4. What are the different moments, and why is kurtosis called the fourth central moment?
There are four central moments, or statistical descriptors, used to describe a distribution.
The first moment is the mean, which describes the mathematical center of the distribution. The second is the variance, which describes the variation of the distribution. The third is skewness, which describes the left or right lean of the distribution. Finally, the fourth moment is the kurtosis, which describes the height and tails of the distribution.
In the formula for kurtosis, you will note calculations are done with certain variables being computed to the fourth power. Hence, the fourth moment.