
There are several ways you can gather data regarding someone’s preference or attitude. The Likert Scale is a five or seven point scale which is used to allow the respondent to express how much they agree or disagree with a particular statement.
Overview: What is a Likert scale?
A Likert Scale is a psychometric scale commonly used in research questionnaires in psychology, social sciences, statistics, business and marketing. The Likert scale, developed by psychologist Rensis Likert, provides five or seven possible responses to a statement or question that allows respondents to express their relative strength of agreement or feeling regarding the question or statement.
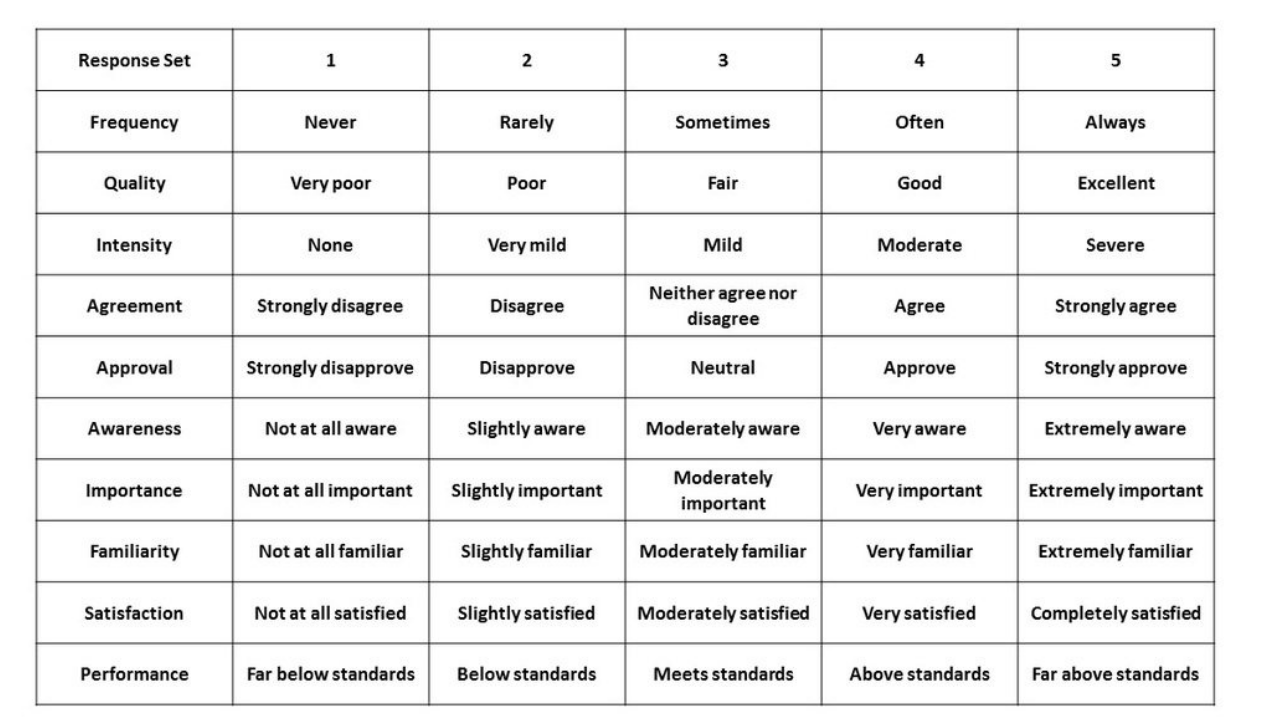
A Likert scale assumes the strength of a response is linear and the distance between the scale values is equal. Each of the five or seven responses would have a numerical value which would be analyzed to measure the attitude or preference being studied. Below are a few examples of Likert scales:
One of the questions that arises when discussing Likert scales is how many values should be in the scale? The most frequent number of choices is 5. You can also use 7 or more. While you may get better discrimination and granularity with more than 5, there is a diminishing return and respondents can be challenged to pick between values. Sometimes an even-point scale is used, where the middle option of neither agree nor disagree is not available. This is called a forced choice method, since the neutral option is eliminated. The neutral option can be seen as an easy option to take when a respondent is unsure.
Care must be taken in evaluating and displaying the results of your survey. The response categories in Likert scales have a rank order, but the intervals between values cannot be presumed equal. The data is not continuous but ordinal. Therefore, the use of mean and standard deviation are inappropriate for ordinal data.You can summarize your data using a median or a mode and you can display the distribution of observations in a bar chart
An industry example of a Likert scale
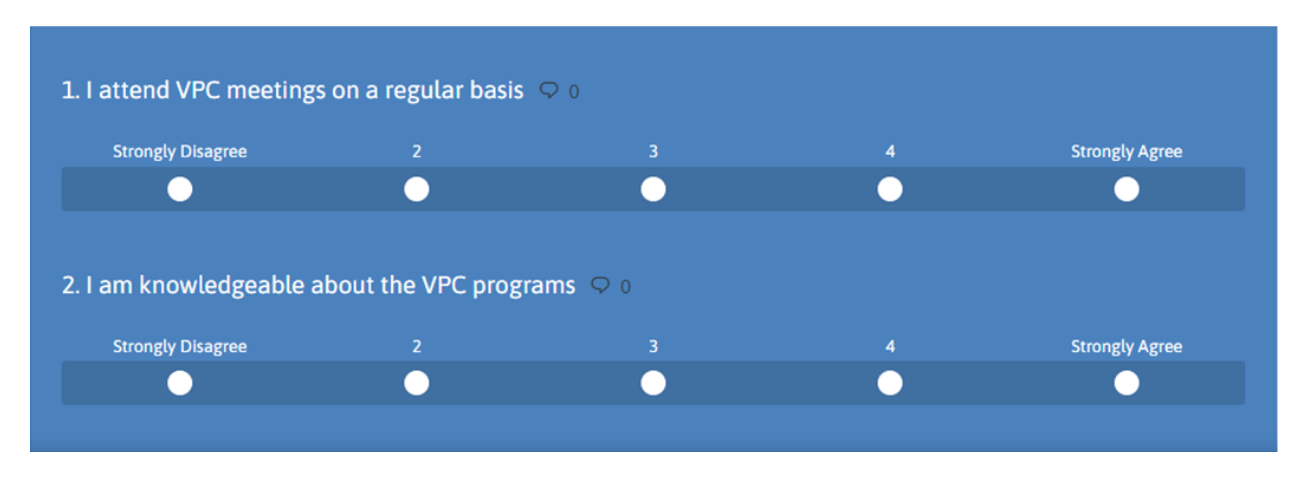
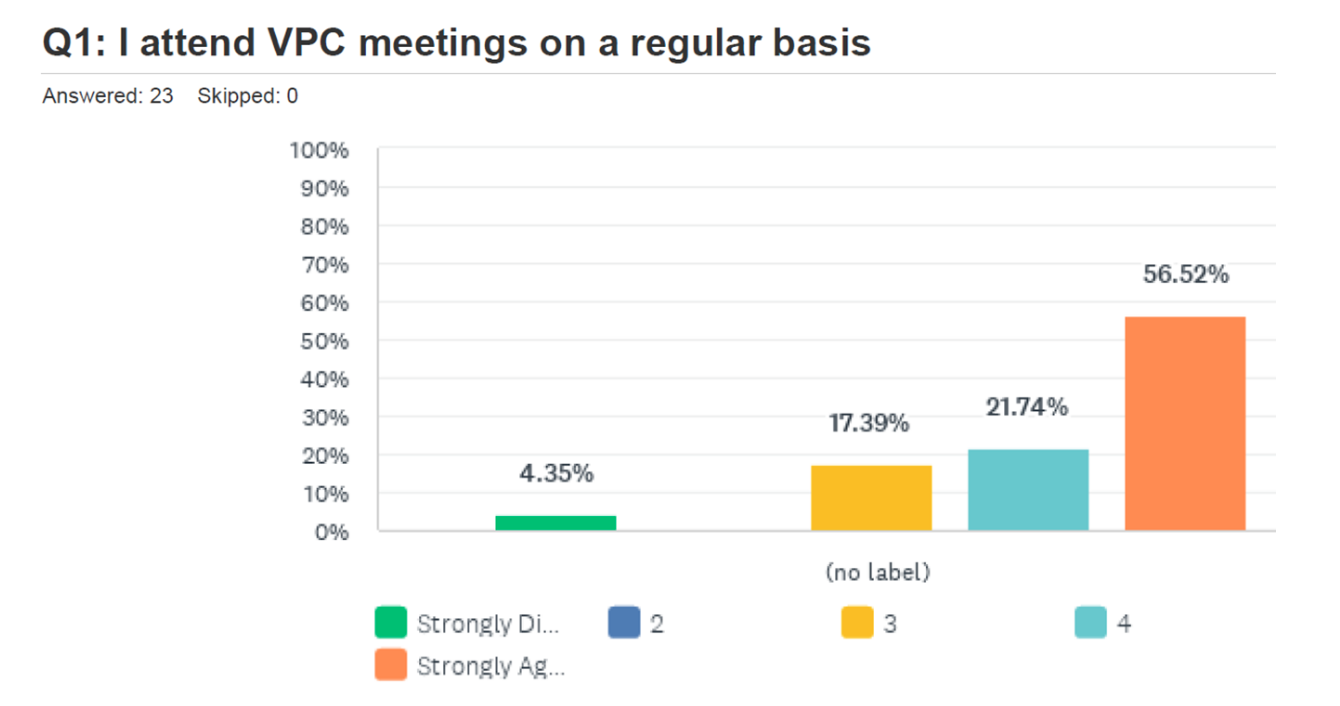
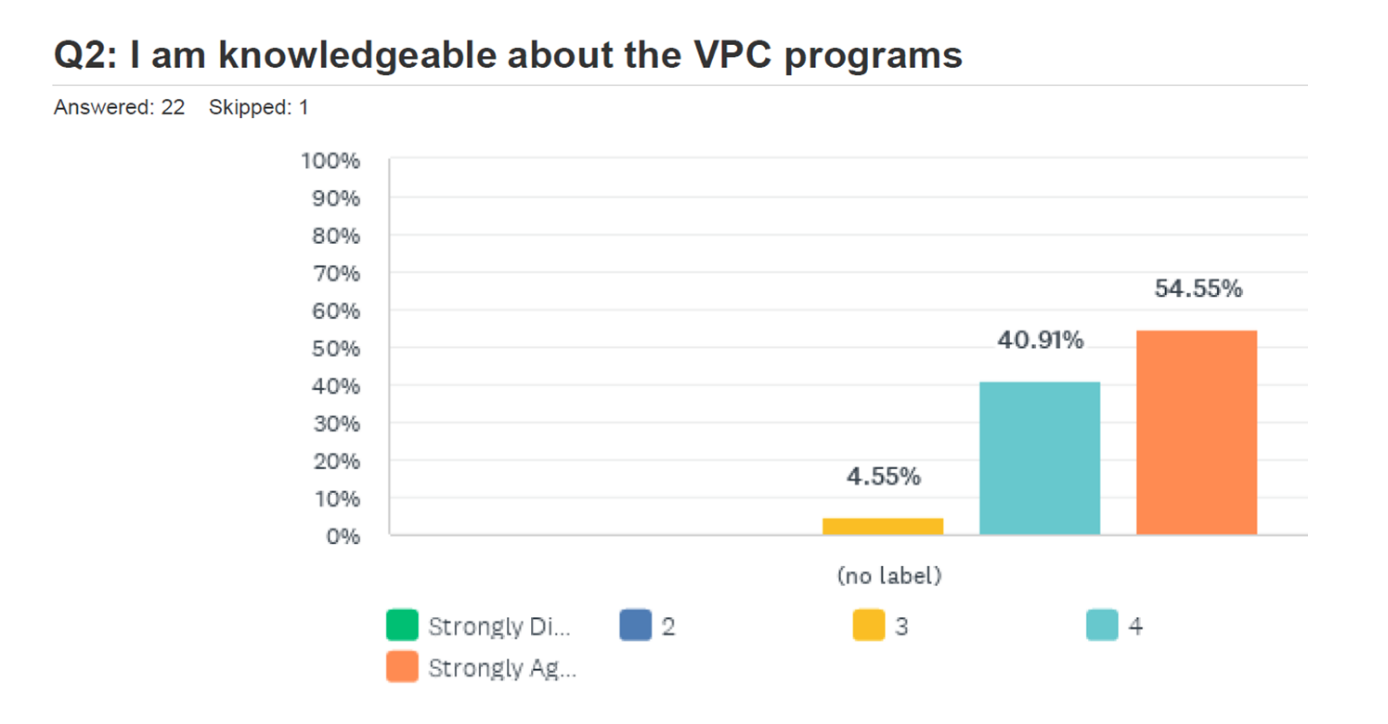
A major public university created a Council of local community leaders to help raise scholarship money and mentor students. The Vice Provost, who headed up the Council, was concerned attendance at Council events was dropping. He asked one of the Council members, who was a Master Black Belt, to create and administer a survey to all the members. Below is a snapshot of a few of the questions and the final output. The information was used to re-energize the Council and make some changes in the membership.
Frequently Asked Questions (FAQ) about a Likert scale
Can I use a Likert scale of more than 5 or 7?
Yes, but beware of possible confusion of the respondents as they try to decide between too many choices. Anything over 10 may not be of any additional value.
Can I treat my 5 point Likert scale as continuous data?
No. The scaling data is ordinal discrete, not continuous. Therefore, using statistics such as mean and standard deviation are not appropriate. Any visual display should be a bar graph rather than a histogram.
Should I use an even or odd Likert scale for my survey?
An even scale will force your respondents to choose a preference. By having an odd number, it is easier for a respondent to just pick the center value and not express a real preference. It is a matter of choice with 5 and 7 being the traditional scaling scheme.