
In the old days, you used tables of the standard normal distribution to calculate the number of standard deviations (Z) that relate to a cumulative probability of a standard normal distribution with a mean of 0 and a standard deviation of 1.
Today, you can use Excel along with many other statistical software packages. Let’s learn more about NORMSINV, what it tells you, and how you can use it for statistical analysis.
Overview: What is NORMSINV?
Let’s start with the bad news. This is from the Microsoft Office Support site:
Important: This function has been replaced with one or more new functions that may provide improved accuracy and whose names better reflect their usage. Although this function is still available for backward compatibility, you should consider using the new functions from now on, because this function may not be available in future versions of Excel.
The new function NORM.S.INV, replaced the NORMSINV function in 2010. The syntax for NORMSINV is =NORMSINV(probability) and for NORM.S.INV is =NORM.S.INV(probability). Fortunately, there is no discernable difference between the two functions, so if you want to use NORMSINV for now, it shouldn’t be a problem.
Here is a brief review of the standard normal distribution to help you better understand what the NORMSINV function is doing. The standard normal distribution is a cumulative distribution with a mean of 0 and a standard deviation of 1. The area under the curve follows a specific distribution according to the standard deviation and the formula below:
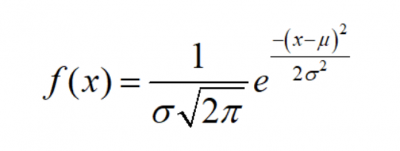
Image source: www.onlinemathlearning.com.
This graph represents the probabilities associated with the standard normal distribution and the standard deviations or Z values.
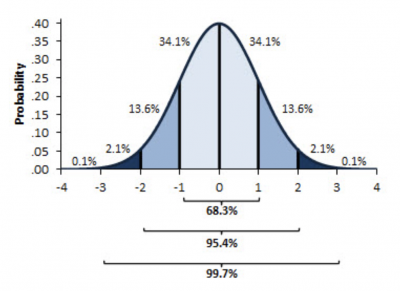
Image source: exceluser.com.
If you wanted to know how many standard deviations encompass 15.8% (13.6% + 2.1% + .1%) of the distribution, you could look at the graph and see it is -1 standard deviations. Why is it -1? Because we said NORMSINV returns the cumulative Z value. That means it starts at the left and starts adding the probabilities until it hits the 15.8%. The actual value you get is -1.00271.
Why isn’t it exactly -1 like the graph? Because the graph is an approximation, and NORMSINV provides the exact value.
What if you wanted to know the same answer for 72.7%? This is where NORMSINV would be useful. Using the syntax of =NORMSINV(.727), you would expect to be somewhere between a Z value of 0 and 1. Why? The value of 72.7% falls between a Z value of 0 (50% cumulative) and a Z value of 1 (84.1% cumulative). The exact answer would be a Z value of 0.60376.
Here is how you would use a Standard Normal table to get your answer.
First, find 0.727 in the table, or as close as you can. Then read across to the Z value on the left (0.60) and up to the top line for the two decimal places (between 0.00 and 0.01). You then estimate between the values since there is no direct Z value for exactly a 72.7% probability. This is why NORMSINV is helpful.
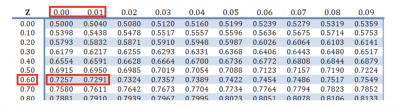
Image source: studocu.com.
Be aware that you might get an error message when using NORMSINV. The most common error messages are:
- #VALUE! — If you put in a probability that is non-numeric
- #NUM! — If you enter a probability <= 0 or >=1
3 benefits of NORMSINV
Having the capability to do the calculations for Z using Excel is much easier than relying on Standard Normal Distribution tables.
1. Reduces the speed of calculation
Using NORMSINV to calculate the Z value is quicker than scrolling through a table of values.
2. Greater accuracy
Tables of the Standard Normal Distribution are limited in their degree of accuracy since they can’t include all the possible values of Z and probability. You have to interpolate the value of Z between probability values.
3. Use of the NORMSDIST function
Given a probability, NORMSINV calculates the cumulative value of Z. NORMSDIST does the opposite. Provide a value of Z, and you will get the cumulative probability. From our example above, if you enter the Z value of 0.60376, NORMSDIST will return a probability of 72.7%, which is the probability of our original example.
Why is NORMSINV important to understand?
The proper use of NORMSINV will make life easier for you.
Understand the proper syntax
The formula and syntax for NORMSINV are very simple. You only have to enter one number, so errors should be minimal.
Know the concept of cumulative
The NORMSINV function starts with your probability of interest and adds up the probabilities from left to right until it hits your desired probability. At that point, it calculates the appropriate Z value.
Understand the various Excel functions regarding the normal distribution
The current version of Excel has a number of functions related to the normal distribution. Understanding how to use them will allow you to do your analysis faster and more accurately. They are: NORM.S.DIST, NORM.DIST, NORM.INV, and NORM.S.INV.
An industry example of NORMSINV
The manager of the company’s call center was interested in what the Z values were for the lower 25% and upper 75% of hold time. She decided to use NORMSINV to answer her question. She used the following formulas:
=NORMSINV(.25) and =NORMSINV(.75)
The two Z values were -0.67449 and +0.67449.
3 best practices when thinking about NORMSINV
NORMSINV is a simple Excel function, but there are still a few things to keep in mind.
1. Use the proper syntax
The syntax for NORMSINV is =NORMSINV(probability in decimal format).
2. Look at a standard normal table
Taking a quick look at a standard normal table will give you an idea of the approximate value for Z. This helps you determine whether the value of NORMSINV makes sense and is correct.
3. Check your answer using NORMSDIST
NORMSINV gives you the Z value for a probability of interest. Taking that Z value and using it in the NORMSDIST function should return the same probability.
Frequently Asked Questions (FAQ) about NORMSINV
1. What is the purpose of NORMSINV?
NORMSINV uses the cumulative probability of the standard normal distribution to return a Z value for a probability of interest.
2. What is the difference between NORMSINV and NORM.S.INV?
NORM.S.INV replaced the NORMSINV function in 2010. It is still available for backward compatibility, but it is recommended that you use the NORM.S.INV function since it is unknown how long Excel will continue to support NORMSINV.
3. What is the proper syntax for the NORMSINV function?
=NORMSINV(decimal value of probability of interest)
Final thoughts on NORMSINV
NORMSINV is an Excel function that provides a Z value for a cumulative probability using a standard normal distribution. If you assume your data is normally distributed and are interested in knowing the Z value for a given probability, NORMSINV will provide that using the cumulative probabilities of the distribution.