
Understanding the different types of data will help you make the right decisions as to the appropriate analytical tools to use for your data. Let’s explore one of the more common types of data: ordinal data.
Overview: What is ordinal data?
Let’s start our discussion with the difference between quantitative and qualitative data. Quantitative refers to numbers and qualitative to categories. Red, green, and blue are qualitative categories while 1, 32, 15 are quantitative numbers.
The four types of data are illustrated in the graphic below:
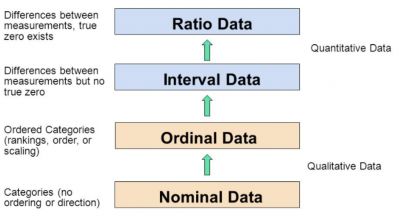
As you can see, ordinal data is a qualitative categorical data type where the categories have a natural, ordered sequence. Ordinal data is distinguished from nominal data by having a ranking or preference sequence.
Some common examples of ordinal data are:
- Likert scale: Strongly agree, agree, disagree, and strongly disagree. Even though your survey may use a 5 for strongly agree, 4 for agree, and so forth, those are still ordinal since the differences between the numbers don’t have real meaning.
- College: Freshman, sophomore, junior, and senior. There is a ranking of the categories.
- Your company: President, Executive VP, Senior VP, VP, Director, Manager, Supervisor, and Operator. Definitely a ranking with preference and benefits associated with the order.
An industry example of ordinal data
The marketing executive was preparing to present the results of a recent customer survey to her leadership. She used a Likert scale to rate how well customers liked one of their products. She used a scale of:
- Definitely will buy again
- Probably will buy again
- Probably won’t buy again
- Definitely will not buy again
She represented each of those ordered categories by the numbers 4 to 1, respectfully.
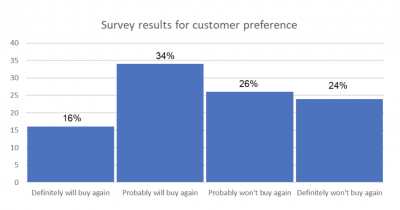
She prepared her presentation and was going to report that buyer preference had a mean of 3.56 and a standard deviation of 1.05. Prior to distributing it, she decided to first run it by the company’s Master Black Belt (MBB) for review. He strongly advised her not to present the results in that form since assigning a quantitative value to the ordered categories was not appropriate nor did it really tell a story.
He suggested the data be presented as qualitative data in the form of the proportion of customer responses. The graph below shows the eventual output she presented to her leadership.
Frequently Asked Questions (FAQ) about ordinal data
1. What is the difference between nominal and ordinal data?
While both are qualitative data and categorical, ordinal data has a natural order or sequence. Nominal data may be red, green, and blue, which have no order. Ordinal data may be high, medium, and low, which do have an order.
2. Can I use parametric statistics for analyzing ordinal data?
Generally no, since the ordinal values have no interval differences as would quantitative data. Even if a Likert scale is used with numbers, the differences between a 1, 2, 3, or 4 have no defined or meaningful difference.
3. Can I sometimes convert ordinal data to quantitative data?
Yes. For example, if you were collecting data on delivery time to your customers, you might be tempted to use an ordinal description such as: never late, sometimes late, always late. As an option, you might collect actual delivery times. So, rather than saying you are always late 19% of the time, you might report you are, on average, 57 minutes late with a standard deviation of 6.2 minutes. This is more meaningful and would allow you to see change over time for your delivery performance.