
One of the graphical tools used to monitor your process variation over time is the run chart. At the most basic level, you can visually see trends and certain patterns. The runs test will allow you to confirm the randomness of your data sequence by analyzing the data for a number of more comprehensive characteristics.
Overview: What is a runs test?
The runs test for randomness can help you identify special causes of variation in your process. Patterns in your data indicate whether the variation you see in your data is due to causes that come from outside the system (special cause variation) or is a natural part of the process (common cause variation). A process is in control when only common cause is present.
A normal pattern for a process in control is randomness. If only common causes of variation exist in your process, then your data should exhibit random behavior. The runs test seeks to detect and understand any trends, oscillation, mixtures, and/or clustering in your process data.
The following are the four non random patterns that the runs test looks for (Runs test):
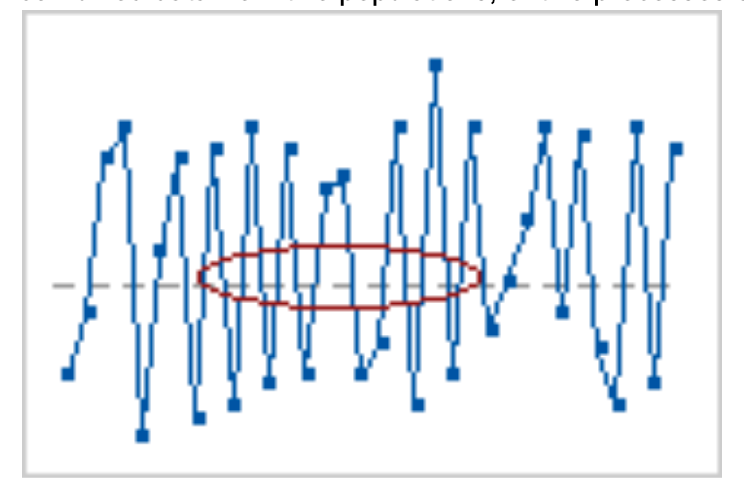
1. Mixture patterns
A mixture is characterized by frequent crossing of the center line. Mixtures often indicate combined data from two populations, or two processes operating at different levels.
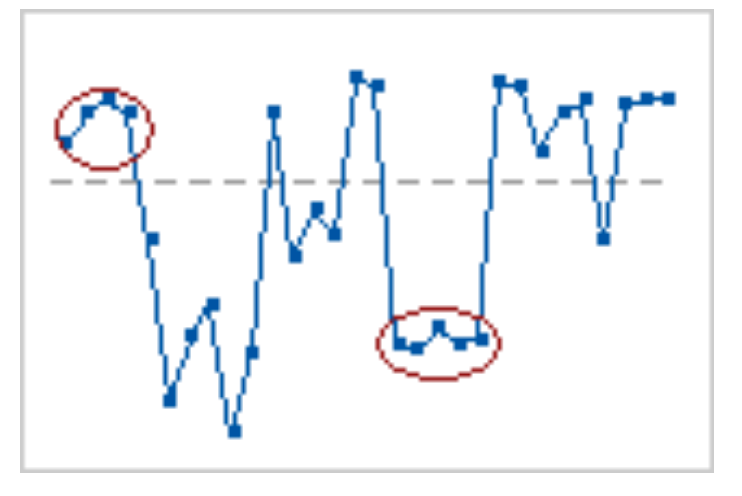
Cluster patterns
Clusters may indicate variation due to special causes, such as measurement problems, lot-to-lot or set-up variability, or sampling from a group of defective parts. Clusters are groups of points in one area of the chart.
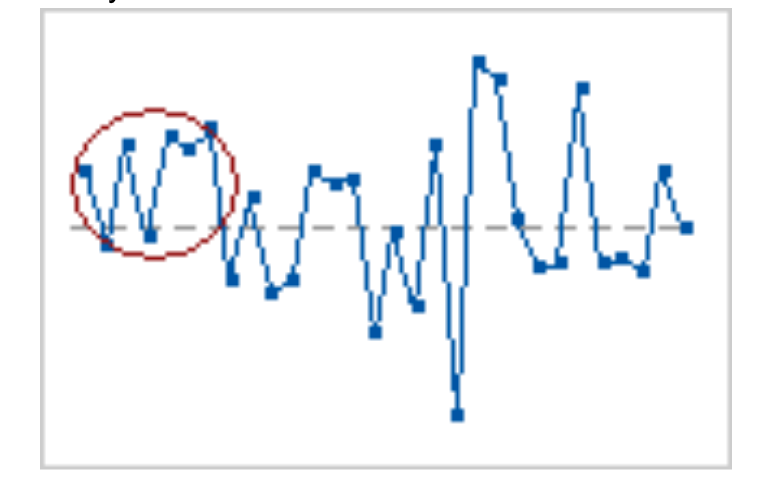
Oscillating patterns
Oscillation occurs when the data fluctuates up and down, indicating that the process is not steady.
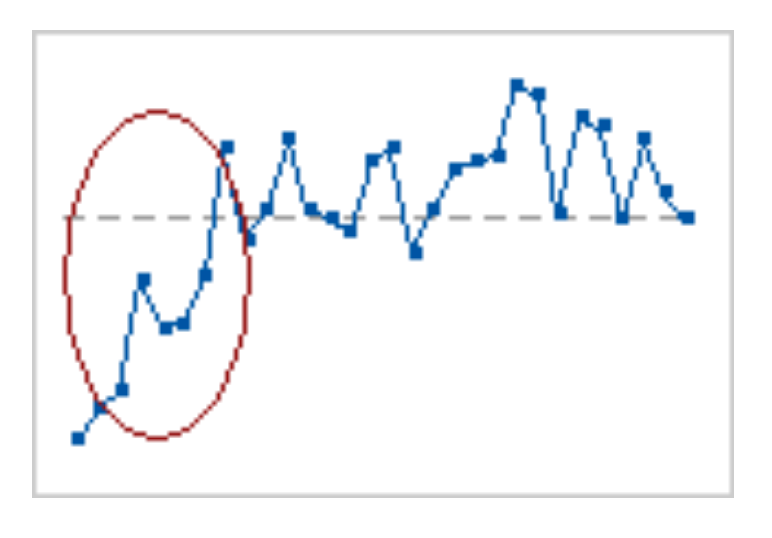
Trend patterns
A trend is a sustained drift in the data, either up or down. Trends may warn that a process is or likely will soon go out of control, and may be due to such factors as worn tools, a machine that will not hold a setting, or periodic rotation of operators.
An industry example of a runs test
A Six Sigma Black Belt (BB) wanted to know whether the data he collected from the production process was random. He decided to use a run chart to see if there were any trends or patterns indicating non randomness. Using a popular statistical software product, he constructed the run chart and did a runs test on the data. The graphic below shows the computer output.
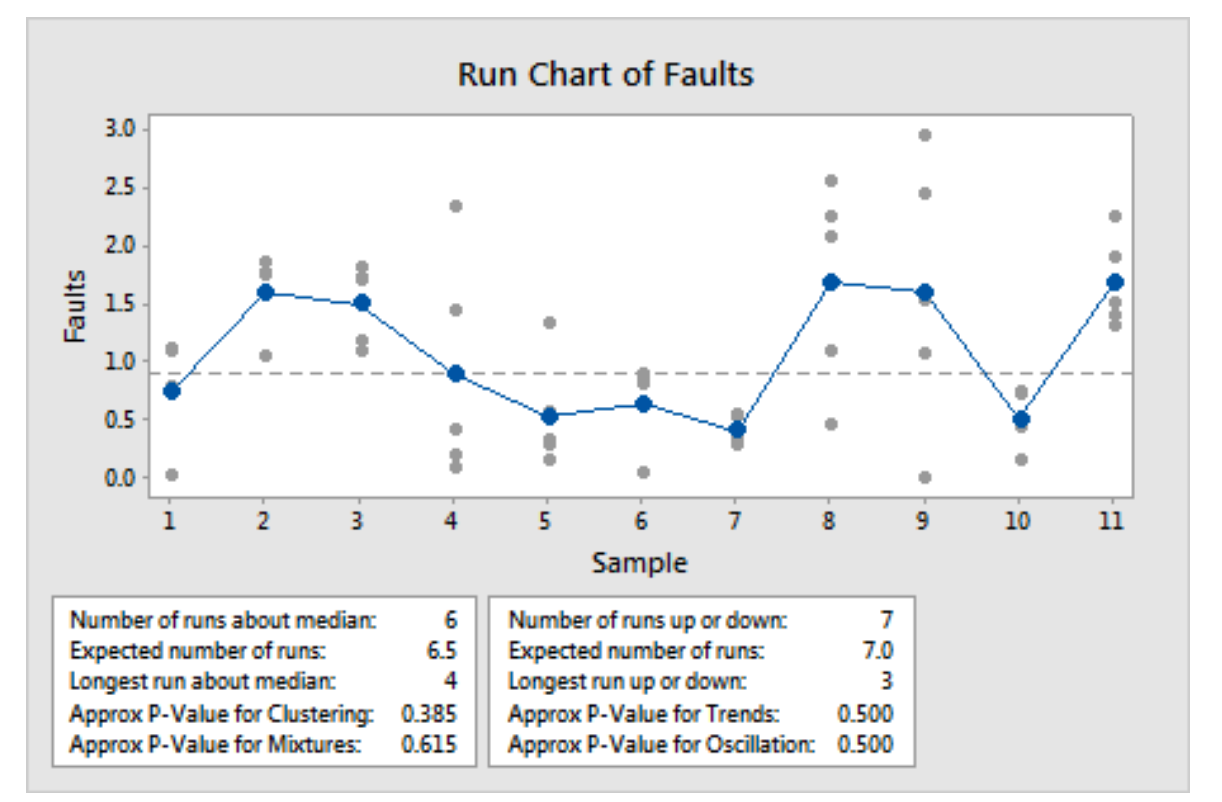
He assumed an alpha risk of 0.05. Since all the p-values for clustering, mixtures, trends and oscillation are greater than 0.05 he will fail to reject the null that the sequence is random.
Frequently Asked Questions (FAQ) about a runs test
What is a runs test used for?
The runs test is a statistical technique for testing whether a sequence of data has been collected from a random process exhibiting common cause variation.
What types of patterns does the runs test look for?
The runs test seeks to detect and understand any trends, oscillation, mixtures, and/or clustering in your process data.
Is the runs test a type of hypothesis test?
Yes, it is a non-parametric hypothesis test based on a binomial distribution. The null hypothesis (Ho) is the sequence of data is random and the alternative hypothesis (Ha) is the sequence of data is not random.