
If your organization produces many different products, with multiple SKUs, you will have a difficult time properly applying traditional control charts. This is especially true if each production run is of short duration. Let’s explore a way to capture all the diverse short production runs in one simple chart.
Overview: What is short-run SPC?
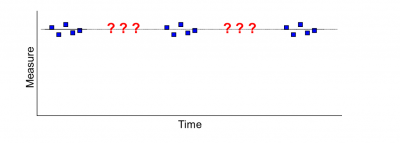
The graph below shows the challenge of monitoring information for different products on a single chart when the production run is short. Note how each product has different characteristics with respect to its central tendency and variation.

One option would be to create a control chart for each product but then there would be gaps in the time-line making it difficult to understand the continuous nature of the process.
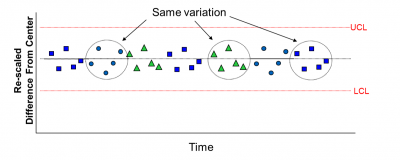
If the data is centered around a common line, a single control chart can be used for all the data unless some products have more variation than others as shown below.

But, if the centered data is re-scaled so the variation in each product is the same, then a single control chart can be used for all the data. This is shown in the chart below.
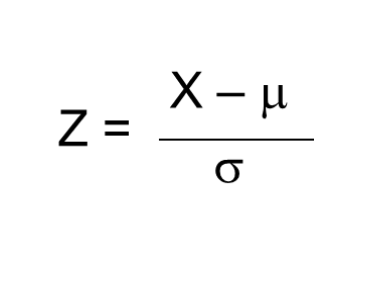
To re-scale and center the data, divide the difference between a data point and the mean of the data by the product standard deviation (Sigma). We will call the result Z or Z score. This is the formula:
Sigma represents common cause variation and is calculated for each product, based on the I-MR control chart for that product.
The basic steps to re-scale and center within each product are:
- Create an I-MR control chart to get the Mean and R bar (average moving range)
- Calculate Sigma = (R bar)/d2
- Calculate Z
- Combine all the data
- Create an I-MR control chart of Z which you can now designate as a Z-MR chart
3 benefits of short-run SPC
The short-run SPC Z-MR chart has the following benefits:
1. Allows for consolidation of multiple short production runs
By converting the central tendency and variation of different product runs, you are able to create a single chart to identify common cause and special cause variation in the overall process.
2. Simple computations
Most statistical software will do the calculations for you and create a Z-MR chart. If not, the calculations are no more complicated than adding, subtracting, multiplying and dividing.
3. Easy to interpret
By looking at and interpreting a single chart, you avoid the confusion of trying to make sense of differing means and variation of your different short production runs.
Why is short-run SPC important to understand?
Rather than worrying about monitoring multiple short run data, your understanding of short-run SPC will enable you to quickly and easily interpret your overall process variation. This will keep you from worrying about interpreting each individual product run.
The use of Z
Using Z as a generic conversion of individual run means and standard deviations makes it easier to combine the multiple short production runs of differing products.
It isn’t magic
Some critics may be suspicious you are manipulating the numbers to get what you want. While you may be re-scaling the numbers to represent a generic metric, the relationship of the underlying data still remains the same.
Use with continuous data
The Z score applies to continuous or variable data with an underlying link to the normal distribution.
An industry example of short-run SPC
The Master Black Belt (MBB) of the company was trying to convince the Director of Manufacturing to use control charts to monitor the process. The Director was concerned because the production runs were short and there were frequent changeovers of different products. The MBB suggested the use of short-run SPC. Below are some of the charts that were made before settling in on the use of the Z-MR chart.
This first chart shows what the I-MR chart looked like when plotting the different products on a single chart. Note the many signals of special cause variation because of the differing values for the products.

The next chart shows what the control chart would look like if calculations were made for each production run. Interpretation is very difficult.
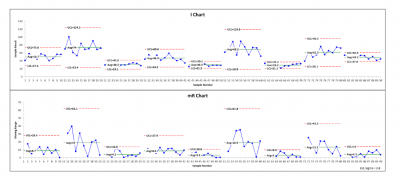
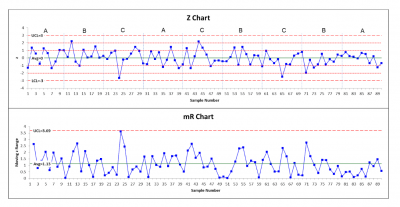
Finally, the MBB used a statistical software package to create a Z-MR chart. You can now see that all points are in control and behaving in a random fashion. The Director can now claim the process is exhibiting common cause variation and no action is required on the process other than to continue trying to improve the process.
3 best practices when thinking about short-run SPC
Here are a few tips to help you use the Z-MR chart for short-run SPC.
1. Be sure you have valid continuous data
Do a Measurement System Analysis (MSA) to be sure the measurement system is capable of providing trustworthy repeatable and reproducible data.
2. Is short-run SPC really applicable?
You will need to determine an operational definition of short-run. Is it for 10 units? 100 units? 1,000 units? There is no correct definition of short-run. Are there enough different products to warrant a Z-MR chart or should you use a few I-MR charts instead? Again, a judgment call on your part.
3. Use statistical software if possible
While the calculations for a Z-MR chart are not difficult, they are tedious, so use a statistical software package to do the calculations and control chart for you. Even the less expensive programs have this functionality.
Frequently Asked Questions (FAQ) about short-run SPC
What is the major benefit of short-run SPC?
It allows you to create a single chart for monitoring short-run production data when you have multiple products with differing central tendencies and variation.
Can I use short-run SPC for sub-grouped data as well as individual data?
Yes, but, unless the context provides a good reason for subgrouping, Dr. Donald Wheeler recommends plotting individual values with short-run data on a Z-MR chart. However, if you have data which logically belongs in subgroups, and those subgroups are all the same size, the Z-bar chart will allow you to plot the subgroups for different products on the same chart.
How do I transform my data into a Z value so I can use it for my short-run SPC chart?
A Z value or Z score is calculated by taking the difference between a data point and the mean of all the data points and dividing by the standard deviation. The formula is:

Wrapping up our discussion on short-run SPC
Short production runs cause problems when attempting to use traditional control charts because there may not be enough data to calculate control limits in a timely manner. Usually, the run for a given part number is over before the control limits can be calculated and drawn on the chart. Some organizations have hundreds of parts so trying to use a control chart for each is not very effective in evaluating the performance of the process over time.
Although traditional control charts may not be applicable, the concept of SPC is still applicable although they must be adjusted for smaller runs. The adjustments to these charts allow operators to plot different part numbers on the same chart by the use of a special data transformation that scales the data from different part numbers to one common distribution. That transformation is the Z value.
Using a Z-MR chart instead of the traditional I-MR or Xbar/R chart allows for the simple monitoring of different production runs.