
While the term “spread” is used in food applications and describes how a product is distributed across, for instance, a slice of bread, we will describe spread in terms of statistics and variation. We will present 5 common methods of calculating the spread of your data.
Overview: What is spread?
Spread, in the context of statistics, describes the variation of your data and how dispersed or spread out it is. This spread is often expressed in terms of your data’s departure from the central tendency of your data.
Five common measures of spread are; range, span, standard deviation, variance and interquartile range.
Let’s describe each of these.
- Range: The difference between the highest and lowest values in your data set. It is calculated by subtracting the lowest value from the highest value. It represents the extremes of your data.
- Span: Attempts to remove the influence of outliers by looking at the difference between the 5th and 95th percentiles of the data rather than the difference between the highest and lowest values.
- Standard deviation (s.d.): Expressed as a unitless measure representing the average deviation of the data points from the average of the data points. If the s.d. is small, then the spread of the data is low. If the s.d. is high, then we conclude the data is dispersed or widely spread out relative to the mean.
- Variance: The square of the standard deviation.
- Interquartile range (IQR): The difference between the first quartile (25%) and third quartile (75%) of the data. This encompasses 50% of the data.
An industry example of spread
Traditionally, a small electronics company only reported out the mean, or average, for most of their performance metrics. One day, the chief engineer came across a 1998 Annual Report for GE that he found very informative.
In it, they said the following: “…the mean never happens…The customer only feels the variance…Variation is evil in any customer-touching process.”
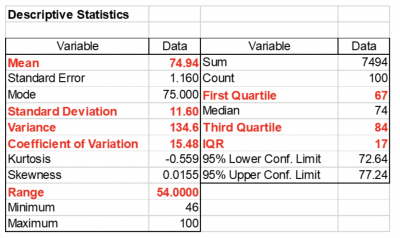
Going forward, the engineer reported not only the average for his metrics but also the range, standard deviation, variance and interquartile range. Below is the output he presented. This allowed for a deeper understanding of the variation or spread of his data.
Frequently Asked Questions (FAQ) about spread
1. What statistical tool uses the interquartile range?
The boxplot is a graphical tool in which the “box” refers to the use of the interquartile range to display the variation of 50% of the data.
2. Why would I use the variance instead of the standard deviation?
The variance needs to be used for any mathematical calculations with respect to variation. On the other hand, the standard is more practical because it is expressed in terms of the original units of the data, while the variance is expressed as units squared.
3. What is the coefficient of variation?
The coefficient of variation (CoV) is a relative measure of the spread of your data to the mean of the data. It is calculated as the standard deviation divided by the mean and expressed as a percentage. If the CoV is large, it means the spread of your data is wide. If low, it indicates your spread is narrow.