
In this brief article, we will define what variance is, how it is calculated, and some tips on how to use it to make business and statistical decisions.
Overview: What is variance?
Variance is the average of the squared differences between each data point and the average of all the data points. It can be used for both population as well as sample data and represents the dispersion of the data around the mean of all the data.
It is used in the fields of descriptive statistics, inferential statistics, hypothesis testing, and other common statistical tools. Below are the formulas for variance of a population and variance of a sample.
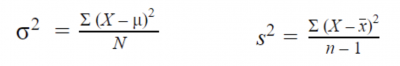
- Σ = sum of…
- Χ = each value
- μ = population mean or xbar = sample mean
- Ν = number of values in the population or n= number of values in the sample
Standard deviation is the square root of the variance. The standard deviation is more commonly used in statistics because it is in the original units of measure, whereas the variance is the units squared. While standard deviation is more easily understood, variance is important because it can be used for algebraic and mathematical computations.
An industry example of variance
A manufacturing manager wanted to determine the average variation of downtime for three production lines. Although he had calculations of standard deviation for the three lines, he knew he couldn’t just average those.
His Master Black Belt recommended he calculate the average of the three variances of the lines, and then take the square root of that value. This would give him the correct value for standard deviation and provide an answer in the original units of hours rather than hours squared.
3 best practices when thinking about variance
Here are some tips on how to use variance to make the proper statistical decision regarding your process.
1. Decide whether to use the population or sample calculations
You want to decide whether to treat your data set as a population or a sample since the formulas you use will be different.
2. Remember: You can’t easily do mathematical or algebraic computations with standard deviations
Use the variance for your calculations and convert to standard deviation if you want your answers to be in the same units as your data.
3. Use n-1 when calculating the sample variance
Using n when calculating sample variance will give you a biased estimate. To overcome that, use n-1 to get the unbiased estimator.
Frequently Asked Questions (FAQ) about variance
Why is n-1 used in the formula for sample variance?
With samples, n – 1 is used because n would give you a biased estimate that underestimates variability. The sample variance would tend to be lower than the real variance of the population. Using n – 1 makes the variance artificially large, giving you an unbiased estimate of variability.
What are the units in variance?
Since the variance calculation uses the squared differences between each data point and the mean of the data, the units will represent the original units squared. Taking the square root of the variance gives you the standard deviation, which will be in the original units of the data.
What is the lowest value variance can be?
Zero. This occurs when there is no variation in the data, so the squared differences will all be zero.
Wrapping up variance
Variance is a common statistical calculation representing the average dispersion of the data around the mean. It is computed by taking the average of the sum of squared differences between each data point and the overall average of the data.