
The quality of environmental hygiene in hospitals is under increasing scrutiny from both healthcare providers and consumers because the prevalence of serious infections due to multidrug-resistant pathogens has reached alarming levels. The transfer of gram-positive bacteria, particularly methicillin-resistant Staphylococcus aureus (MRSA) and vancomycin-resistant enterococci (VRE), among patients is a growing concern. One critical factor for transmission of a microorganism from a person (patient or healthcare worker) to the environment and then to another person is the ability of that microbe to survive on that environmental surface.
New York’s North Shore-LIJ Health System was faced with the challenge of keeping the hospital environment safe from the transfer of these pathogens, while also cutting back the waste and cost involved in doing so. The following case study illustrates their use of Six Sigma in this effort.
Define
As per Joint Commission and Centers for Medicare and Medicaid Services (CMS) infection control standards, as well as the health system’s infection prevention and control goals, all unused patient supplies in the cardiothoracic unit (CTU) must be discarded when a patient is discharged or transferred from a room. An initial cost assessment, which did not factor in disposal cost, found that unused supplies valued at approximately $66.11 were discarded in the CTU per discharge. In addition to the cost, this issue impacts labor, product availability and time management on the unit.
A cross-functional Six Sigma team was formed to address the disposal cost issue. The team was composed of staff from administration, environmental services, cardiac critical care nursing, infectious disease and finance. The team’s goal was to decrease the amount of discarded unused supplies by 50 percent. The benefit to the organization would be cost savings, decreased inventory, increased efficiency and decreased patient infection.
The first step was to develop a high-level process map (Figure 1) and gather baseline performance information.

Measure
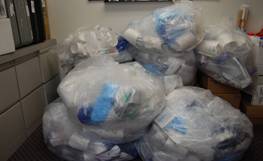
To collect data, environmental services employees did a manual collection of unused supplies upon discharge; the supplies were then counted by the Six Sigma team. The team performed a gauge in which discarded items per discharge were counted by several team members on several days. Repeatability was 100 percent and reproducibility was 82 percent.
An initial sample size calculation determined that the team needed to review at least 44 discharges; they ended up counting the unused supplies from a total of 52 discharges. The team determined that each time a patient was discharged, approximately 67 unused items were discarded, ranging in price from pennies to more than $100 per item. The Y1 of cost was an average of $66.11 per discharge.
A stakeholder analysis showed there was moderate resistance to the project on the unit (Table 1). The resistance was political, technical and cultural. The team utilized the “what’s in it for me” strategy to move staff to a more supportive position.
| Table 1: Stakeholder Analysis | |||||||
| Stakeholder | -2 | -1 | 0 | 1 | 2 | Type of Resistance | Plan of Action |
| Sponsor/Champion |
X |
||||||
| Unit director |
X –> |
X |
Political | Provide data showing cause and effect of new process. |
|||
| Manager |
X |
–> |
X |
Technical; Cultural | Provide data showing cause and effect of new process. Emphasize that assistance will be offered. Incorporate director’s input into new process. |
||
| Registered nurses (RNs) against change |
X |
— |
–> |
X |
Technical; Cultural | Create focus groups to gather feedback. Incorporate input from RNs into new process. |
|
| RNs for change |
|
X |
Encourage RNs to lead by example with new process. |
||||
| Patient care assistants |
X |
–> |
X |
Technical; Cultural | Re-enforce to assistant team that end result of new process is a decrease in their workload. |
||
Analyze
Utilizing a cause and effect diagram, the team identified the key drivers for wasted supplies by quantity and type (Figure 2).

Because of the large number of x’s that could impact the Y, the team performed a failure mode and effects analysis (FMEA). For each step of the process, they determined what could go wrong, the effect of the failure, the severity if this occurred, potential causes, how often the failure occurred, current controls in place and their ability to detect the failure. In many steps of the process, there were multiple potential failure points. A risk priority number (RPN) was assigned to each failure point.
The team used graphical analysis and hypothesis testing to review defects by categories such as day of the week discharged, nurse, surgeon, length of stay, patient care assistant and day of the week admitted. When the defects were categorized by item types such as syringes, dressing, respiratory equipment and IV bags, there was a statistically significant difference based on the Chi Square test. Procedure type (valve, aneurysm, CABG) was also statistically significant utilizing Chi Square.
During this analysis, the team also had an “a ha” moment. Medications that were stocked in the room lock box and which should never have been discarded unused were being discarded. All rooms were stocked by a pull list that listed items and quantities. In Analyze, the team found that most unused items that were discarded came from the pull list rather than additional items that were brought in specifically for the case, as the staff initially thought.
Improve
At the beginning of Improve, the team reviewed the high-level process map. Using Lean and just-in-time principles, the team thought if they could remove the restocking step of the process, it would decrease the amount of unused items discarded. They created one improvement strategy to address their four vital x’s of: item category, procedure type, stocked versus non-stocked medications and pull list versus non-pull list items. The proposed solution was to provide a fully stocked cart with appropriate quantities (by item category) within a patient’s room in the CTU. These carts would be stocked once daily and patient care supplies would be pulled from the supply cart according to patient needs. The carts already existed in several of the rooms, but each cart was stocked differently.
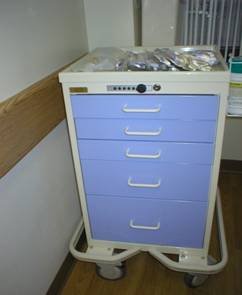
The team encountered resistance from the staff and decided to do a design of experiment (DOE) to see if a standardized cart would meet the needs of the department. The team created a revised list of supply items needed in each room. The exterior of each drawer on the supply cart was labeled to match the supply location within the cart. The staff reviewed the proposed supply items as well as their placement. It took a total of three days to capture input from staff on all shifts. A copy of the revised list was placed on the side of each cart for easy restocking. Each cart was equipped with a hand sanitizer dispenser and sanitary wipes for best practice in infection control (Figure 3). A two-level, two-factor DOE was performed. The factors were: cart present or absent and procedure type major or minor.
| Figure 3: Supply Cart Before and After Improvement | |
 |
 |
Data was captured for a total of eight trials. The main effects plot demonstrated that the cart was the key driver in lowering the amount of unused items discarded upon discharge. The statistical analysis of the DOE using analysis of variance (ANOVA) demonstrated the p-value for the cart to be significant and the p-value for the procedure type to be not significant. There was no interaction between cart and procedure (Figure 4).
|
|||||
Control
After sharing the results of the DOE with the staff, the team was able to obtain buy-in for their improvement strategy. The team rolled out an additional five carts for a total of seven carts. The amount of unused items discarded per discharge decreased from an average of 67 items per discharge to an average of 13 items per discharge (Figure 5).
| Figure 5: Unused Supply Collection Changes | |
 |
 |
The total cost of items discarded decreased from an initial cost of $66.11 per discharge to $9.16 (Table 2).
| Table 2: Metrics for CTU Waste Reduction Project | |||||||||||
| Target | USL | Initial | Pilot (DOE) | Current | |||||||
| Avg. Defect | DPMO | Sigma | Avg. Defect | DPMO | Sigma | Avg. Defect | DPMO | Sigma | |||
| Y-1 | $33.70 276,212 DPMO 2.1 sigma |
$67.4 | 552,428 | 1.4 | $37.4 | 306,352 | 2.1 | 13.5 | 110,340 | 2.8 | |
| Sub Y-1 |
$33.06 63,915 DPMO 3.1 sigma |
$50 | $66.10 | 127,830 | 2.7 | $16.33 | 31,574 | 3.4 | $9.16 | 17,720 | 3.7 |
In order to outfit the remaining seven CTU rooms with carts, the Six Sigma team did a financial analysis demonstrating a 163 percent return on investment within one year for the purchase of seven additional carts (Table 3).
| Table 3: Project’s Financial Impact | |||
| Cardio Thoracic Unit – Seven Rooms Implemented | |||
| Expense Per Discharge* | Annual Discharges** | Financial Impact | |
| Current waste – average unused supply expense | $66.11 | 485 | $32,000 |
| Expected waste – average unused supply expense | $9.16 | 485 | $4,438 |
| Average expense avoidance | $56.95 | $27,592 | |
| Opportunity – All 14 Rooms | |||
| Current waste – average unused supply expense | $66.11 | 969 | $64,061 |
| Expected waste – average unused supply expense | $9.16 | 969 | $8,876 |
| Average expense avoidance | $56.95 | $55,185 | |
| Expense Per Cart | Carts Needed | Initial Cost | |
| Recommended investments | $1,500 | 7 | $10,500 |
| Average expense avoidance (7 additional carts): $27,592 | |||
| Return on investment ((savings – cost)/cost): 163 percent | |||
| *Supply expense calculated from materials management acquisition cost | |||
| **Cardiac discharges/transfers from CTU with LOS < 7 days from TSI FY2008 | |||
The team established a control plan with monthly reporting of metrics at the CTU performance improvement meeting. Statistical process control was used to keep staff informed. The project was presented at the hospital-wide Organizational Excellence meeting in order to translate lessons learned to other units within the hospital.
Other accomplishments of this initiative included the enhanced staff awareness of the quantity of supplies discarded and their associated cost. The unit also experienced an increase in product availability and an improvement in staff time management.