About Betfair
Betfair is the world’s biggest betting community, due in part to the fact that it offers its more than three million customers the opportunity to choose their own odds and bet against each other. Betfair’s international betting exchange processes more than 5 million transactions each day, and 99.9 percent of those transactions are completed in under a second.
To improve the success of marketing phone calls to registered but unfunded customers, Betfair launched a Six Sigma project.
Define
Betfair measures the success of these phone calls based on two metrics: customer contact and conversion. A good contact occurs when an agent reaches and talks with a customer for longer than one minute. A poor contact occurs when a customer does not answer, or briefly answers and immediately expresses disinterest. A conversion occurs when the contacted customer places a bet of any kind or amount.
The project scoped was limited to a test region. At the beginning of this project, Betfair outbound agents got through to the customer 44 percent of the time (contact rate). Of the contacted customers, 48 percent went on to fund and place a bet (conversion rate). Compared to industry standards these levels are relatively low, indicating room for improvement. In addition, it is clear that an increase in these metrics will have a direct effect on the number of acquisitions without increasing the fixed cost to the business.
Measure
The project team began the Measure phase by drafting a high-level process map to identify the key steps in the existing process (Figure 1).
A measurement system analysis was also carried out, which indicated a discrepancy between the automatic system measurement and the agent measurement. The problem was identified as a training issue and was addressed before the project moved forward.
Once the improved measurement system was in place, baseline data was collected, and normality, capability and stability studies were completed to assess the performance of the existing process.
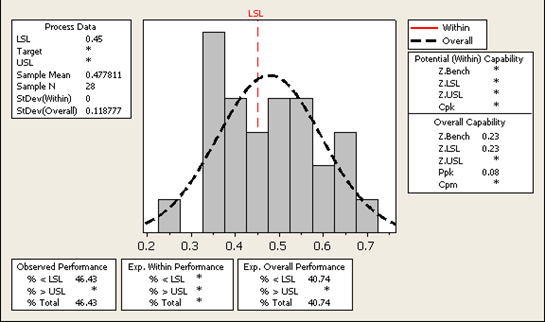
With a lower specification limit (LSL) of 45 percent set by the project sponsor, the process capability study for the conversion rate showed that the process was running at a 46.4 percent defect rate – a sigma level of 0.23.
The selected target was to improve the overall average conversion rate from 47.8 percent to 55 percent (see Figure 2). The 15 percent improvement in conversation rate would yield a yearly financial benefit of $210,000.

Additionally during the Measure phase, the team identified a number of quick wins that were implemented right away:
- Introduced a poka-yoke feature to reduce human error when logging call outcomes
- Ran training sessions to improve awareness of conversion rate with all of the agents included in the test region
- Ran a pilot to generate calling lists for agents internally, rather than sending through a third party which significantly increased the process cycle time
Analyze
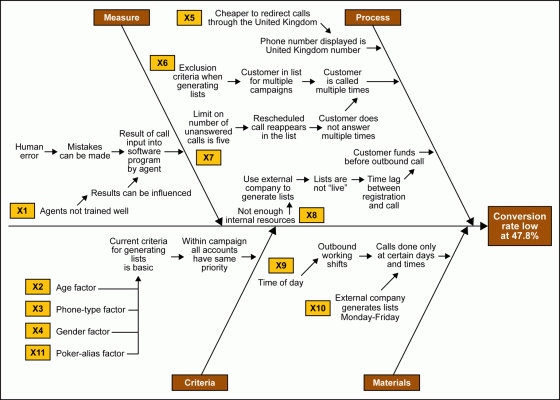
The project team carried out a brainstorming session with the outbound marketing group to identify the root causes of the low conversion rates. A cause-and-effect (fishbone) diagram was used to capture the relationship between the root causes and the key metric – conversion rate (Figure 3). This was followed by initial hypothesis testing of call data, which revealed two factors that had a significant effect on contacts and conversions: the time of day the calls were made, and the lead time between the customer’s registration and the follow-up call. The team then researched various ways these significant factors could be manipulated to optimize both contact and conversion rates. The results showed that higher rates were achieved when the outbound team contacted customers at the same time the customers registered online.

The significant factors identified from the hypothesis testing were then analyzed further with design of experiment (DOE) tools. The designed experiment was used to efficiently optimize the critical factors and responses. With the DOE results, the team drew conclusions about how the significant factors interacted and the impact on the key metric; one key interaction was identified between the time of day and the ideal registration-to-call lead time.
This analysis confirmed that customers should be contacted soon after registration and that afternoon or evening calls on the same day or next day were most effective. The bottom line: the quicker the outbound team could make follow-up calls after customers registered, the more successful the team would be with contacting customers who wanted to place wagers.
Improve

At the time this project started, the outbound team was using an external firm to compile lists of customers who had registered but not funded their accounts or placed a bet – a practice that guaranteed a 24-hour or longer lag time between when a customer registered and when follow-up calls were made. Implementing a new internal reporting system to generate these lists enabled the outbound team to contact customers literally minutes after they registered online. Figure 4 illustrates the updated process.
Control
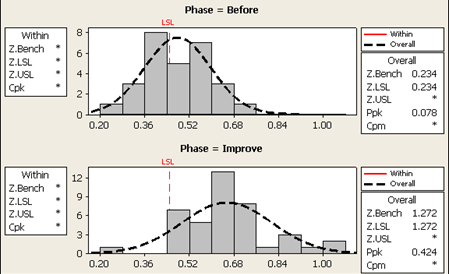
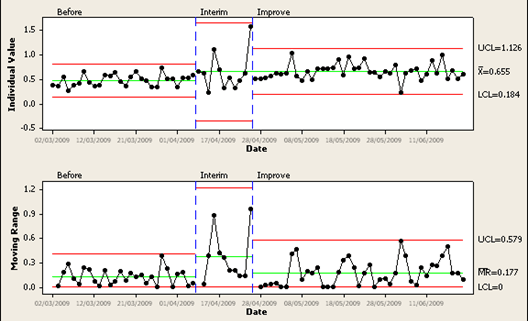
The improvement actions were implemented in the test region and monitored for six weeks. The capability study showed an improvement of 37 percent in the conversion rate, increased to an impressive 65.5 percent compared to 47.8 percent at the project’s outset (Figures 5 and 6).


A number of controls were introduced to ensure that the gains are sustained over the long term. They included the following:
- Control charts were created to monitor the stability of the new outbound call process and detect any special cause variation.
- New guidelines for the new process were agreed to with the process owner. The agents were then trained using these best practice guidelines.
- New owners were assigned to monitor and maintain the new report process.
- Some reporting measures were updated in order to better monitor the performance of the agents.
Results
With a 37 percent improvement in the conversion rate and a 1.04 sigma shift, the project resulted in a gross benefit of $444,300 as well as reduced costs by generating the customer call lists internally.
Due to the project’s great success in improving the conversion rate for the test region, the outbound marketing department quickly rolled out the improvements across other regions. The new process achieved similar results in conversion rates and yielded an additional incremental revenue benefit of $486,500.
