
In this case study, a team wants to be sure their customer-focused business is satisfying its clients. Part 1 focused on reducing the wait times associated with transferring cargo and documents. Part 2 looks at making more improvements using just-in-time (JIT) principles.
It is often possible to make significant improvements in speeding up documentation processes by using just-in-time (JIT) principles:
- Map the information flow
- Identify breaks in the process (if any)
- Capture the information at its generation
- Move it to the point of use as early as possible
- Minimize waiting in any activity
The information required for generating a bill of lading (B/L) – as well as a detailed workflow – is shown in Table 5.
Table 5: Information Required and Work Flow for Generating Bills of Lading (s = sail date) |
||||||
| Step Number | Bill of Lading – Information Required | Source | Receiver 1 | Receiver 2 | Source of Information | Latest Time Required (Days) |
| 1 | Customer requests freight | Customer/Department 1 | From customer | s-5 | ||
| 2 | Determine any special clauses required in B/L | Customer | Department 3 | Standard/known | ||
| 3 | Date/place of issue of B/L | Department 3 | Standard/known | |||
| 4 | Authorized signatory/stamp | Department 3 | Standard/known | |||
| 5 | B/L number | Department 3 | Standard/known | |||
| 6 | Delivery agent | Department 3 | Standard/known | |||
| 7 | Shipping on board date | Department 2 | Department 1 | Ship docks | Standard/known | |
| 8 | Place of receipt at shipping company | Customer | Department 1 | Booking slip | s-5 | |
| 9 | Port of loading | Department 1 | Booking slip | s-5 | ||
| 10 | Port of discharge | Customer | Department 1 | Booking slip | s-5 | |
| 11 | Place of delivery | Customer | Department 1 | Booking slip | s-5 | |
| 12 | Terms of shipment | Customer | Department 1 | Booking slip/delivery order (DO) | s-5 | |
| 13 | Freight payable at | Customer | Department 1 | Booking slip/DO | s-5 | |
| 14 | Vessel | Department 1 | DO | s-5 | ||
| 15 | Voyage | Department 1 | DO | s-5 | ||
| 16 | Container number | Logistics | Department 1 | Customer | Daily pick-up report | s-4 |
| 17 | Shipping marks number | Customer | Department 1 | Shipping bill (S/B) | s-2 | |
| 18 | Number of packages | Customer | Department 1 | S/B | s-2 | |
| 19 | Description of goods | Customer | Department 1 | S/B | s-2 | |
| 20 | Another code number | Customer | Department 1 | S/B | s-2 | |
| 21 | Gross weight | Customer | Department 1 | S/B | s-2 | |
| 22 | Net weight | Customer | Department 1 | S/B | s-2 | |
| 23 | Consignment size | Customer | Department 1 | S/B | s-2 | |
| 24 | Shipping bill (S/B) number | Customer | Department 1 | S/B | s-2 | |
| 25 | Seal number | Customer | Department 1 | Load plan | s-2 | |
| 26 | Shipper | Customer | Department 1 | B/L draft version 1 | s-2 | |
| 27 | Consignee | Customer | Department 1 | B/L draft version 1 | s-2 | |
| 28 | Notified party | Customer | Department 1 | B/L draft version 1 | s-2 | |
| 29 | Number of packages | Customer | Department 1 | B/L draft version 1 | s-2 | |
| 30 | Number of original B/Ls | Department 3 | B/L draft version 1 | s-2 | ||
A process map showed a breakdown in the flow of activity between Department 2 and Department 3, when the process awaits the arrival of the shipping instructions form the customer. Typically three days were lost between the two stages.
Two countermeasures were tried:
- Most of the information on shipping instructions were available in previously submitted documents (e.g., the shipping bill), so an attempt was made to get these documents to Department 1 quickly and let them issue the B/L version 1 for verification to the customer. This, however, led to errors.
- Make the submission of shipping instructions mandatory before issuing confirmation of receipt of the consignment.
The second measure proved successful.
Step 6: Standardize Procedures
The process was standardized through subsequent voyages.
Step 7: Compile Quality Improvement Story
The quality improvement story was prepared and presented to management.
Sustain the Process
Sustaining the process requires continual daily monitoring by a line team to spot and eliminate any deterioration. A motto of “kill a B/L [longest lead time] a day to keep the doctor away” was instituted. A process tracker was developed to spot any fundamental deterioration. Figure two shows an example of the process tracker with the percentage of B/Ls released in s+1 day, s+2 days and s+3 days for one of the major lines of business.
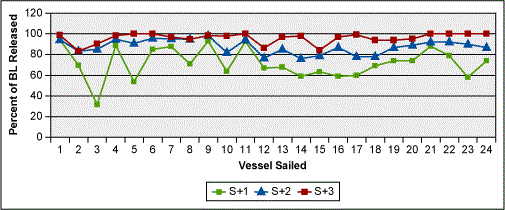
In normal operations, the process gradually stabilized to more than 95 percent of the B/Ls released within s+3 days. In Figure 2, the flatter curve toward the end shows the robustness of the process improving. It was recommended that senior management include this tracker in their monthly performance reviews.
Conclusion
The application of TQM is, essentially, a mindset change. At the end of the project the team members were asked to list what they had learned:
- Work in flow instead of batches
- For efficient problem solving – define, measure, analyze, test
- Increase awareness of qualitative effects at micro-level
- Think about and tackle problems systematically
- Collect data meticulously
- Get total control of business processes
- Foresee and plug problems
- Teamwork helps
Team members did not simply learn a new, or better, B/L process, they learned a new way to work that could apply to all sorts of other processes. The director in charge summarized the success as: “The value of this initiative is that now people talk to each other, everyone is involved in improvement and does what is agreed.”