
If your data demonstrates kurtosis, it is referring to the shape of your data distribution. This article will discuss kurtosis and what it means for your data.
Overview: What is kurtosis?
Kurtosis is often thought of as a statistical measure of the flatness or peakedness of your data distribution. This is incorrect. Dr. Donald Wheeler clarified this by saying “Kurtosis was originally thought to be a measure of the “peakedness” of a distribution. However, since the central portion of the distribution is virtually ignored by this parameter, kurtosis cannot be said to measure peakedness directly. While there is a correlation between peakedness and kurtosis, the relationship is an indirect and imperfect one at best.”
Dr. Wheeler defines kurtosis as “The kurtosis parameter is a measure of the combined weight of the tails relative to the rest of the distribution.” Therefore, kurtosis is all about the tails of the distribution – not the peakedness or flatness. It measures the tail-heaviness of the distribution.
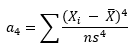
The common formula for kurtosis is:
where n is the sample size, Xi is the ith X value, X-bar is the average and s is the sample standard deviation. Note the exponent in the summation. It is “4”. The kurtosis is referred to as the “fourth standardized central moment for the probability model.”
Here is where it might get a little confusing. If you use the above equation, the kurtosis for a normal distribution is 3. Most software packages use the formula below.
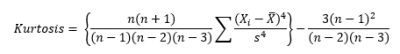
This formula does two things. It takes into account the sample size and it subtracts 3 from the kurtosis resulting in a kurtosis of 0 for a normal distribution. This is really the excess kurtosis, but most software packages just call it kurtosis.
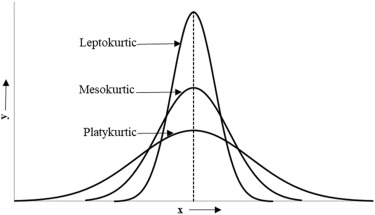
There are three categories of kurtosis. The reference standard is a normal distribution, which has a kurtosis of 3 or an excess kurtosis of (kurtosis – 3 = 0).
- A normal distribution has a kurtosis of exactly 3 (excess kurtosis of 0). Any distribution with kurtosis ≈3 (excess ≈0) is called mesokurtic.
- A distribution with kurtosis <3 (negative excess kurtosis) is called platykurtic. Compared to a normal distribution, its tails are shorter and thinner, and often its peakedness is lower and broader.
- A distribution with kurtosis >3 (positive excess kurtosis) is called leptokurtic. Compared to a normal distribution, its tails are longer and fatter, and often its peakedness is higher and sharper.
The graphic below illustrates the relative shape of the three types of kurtosis.
An industry example of kurtosis
Prior to doing some statistical analysis on a manufacturing process, the company Six Sigma Black Belt (BB) tested her data for normality. Below is her result showing the current process data has a significant degree of kurtosis. You can see that with the long tails and a kurtosis value of over 4.
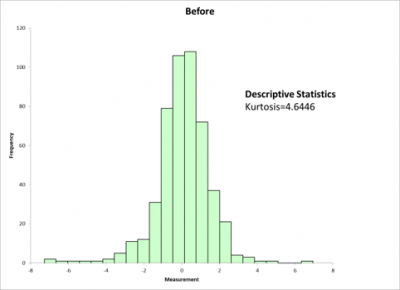
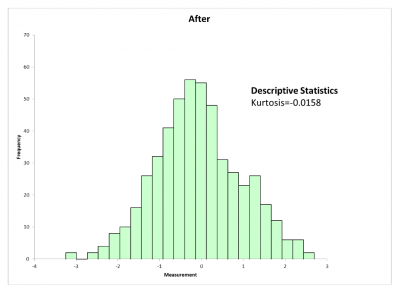
The BB pulled together a team to analyze the reason for the outliers at each end of the distribution. After identifying the reasons, the team made some adjustments in the process which resulted in the process data now being more normal. Note the kurtosis is now essentially 0. This allowed the BB to complete her analyses which had normality as an assumption. See the revised histogram below.
Frequently Asked Questions (FAQ) about kurtosis
What does kurtosis really tell me?
Kurtosis is a statistical measure which defines how the tails of your data distribution differ from the tails of a normal distribution. High kurtosis indicates you have more outliers and have longer tails than a normal distribution. Low kurtosis is the opposite.
What does a kurtosis value of 3 mean?
The kurtosis of a normal distribution is 3. Therefore a kurtosis value of 3 for your data distribution indicates the tails are not statistically different from those of a normal distribution.
What are the three categories of kurtosis?
A kurtosis value similar to a normal distribution is known as a mesokurtic distribution. Platykurtic refers to a kurtosis less than 3 indicating your distribution tails are shorter than a normal distribution. If your kurtosis is greater than 3, your tails are longer than a normal distribution and you can refer to that as a leptokurtic distribution.