
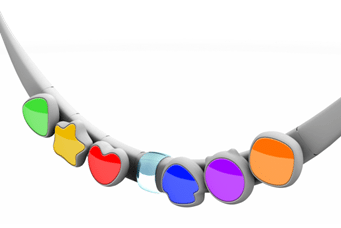
A high-tech company was exploring the use of haptics to provide gentle haptic vibration with wearable devices (Figure 1) for future customers, including tweens (children around 11 or 12 years old). Haptics involve how users perceive tactile feedback from a device. Mobile devices typically provide haptic sensations and responses using vibrations of various frequencies, amplitude, length and pattern.
The goal was to create silent subtle haptic notifications of incoming alerts that would be both comfortable and provide the highest successful notification rate. The study investigated whether vibrational-based notification on the back of the neck would be a viable method of alert. The study also evaluated if hub location or user activity had an effect on perception, then determined optimal vibration level through preference ranking. Design for Six Sigma (DFSS) methods were used to optimize haptic vibration response, which was flowed down to noise and control factors as illustrated in Figure 2.
An experiment was designed that covered a subset of the control factors: vibration length, motor type, band, motor voltage, and whether it was a DC- or AC-driven motor.
The experiment, using the control factors from Figure 2, was designed using a modified central composite design, as shown in Figure 3. In this mixed-level design, some factors were varied over two, three, four and five levels, with a total of 18 treatment combinations.
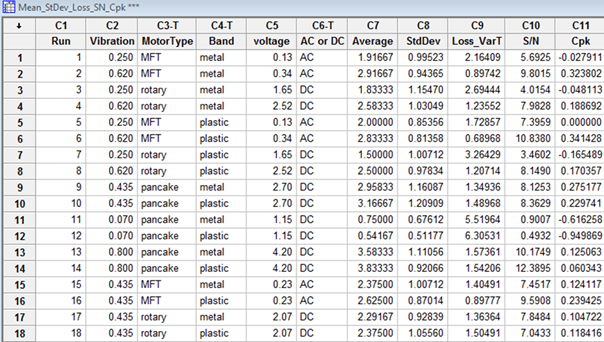
The response of interest involved the subjective feelings of the human subjects, as reflected in a response on a Likert scale of 1 to 5, with the low value of 1 representing that the subjects felt the vibration was too weak and a high value of 5 representing that the subjects felt the vibration was unpleasantly strong. A value of 3 represented the ideal level of perceived vibration, with the range of 2 to 4 being considered acceptable. The noise factors were applied in conjunction with several human subjects including 7 adults and 5 tweens.
The initial runs were conducted with this small set of participants based on previous larger studies. Using a smaller, focused set allow preliminary results to be obtained quickly, with an eye toward planned follow-up tests for the next generation device to better concentrate on the components in a final design.
Ordinal Logistic Regression Analysis of the Designed Experiment
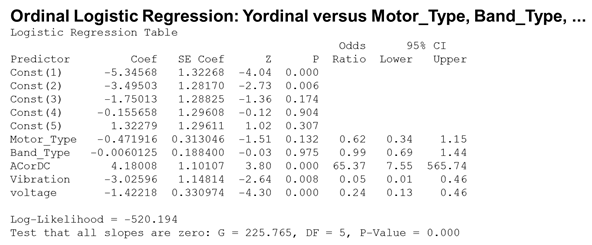
Ordinal logistic regression was used to analyze which factors were statistically significant (Figure 4). Based on the results from ordinal logistic regression, optimal values were selected for the AC/DC factor and motor type.
Robust Design – A Comparison of Optimization Criteria
It is common practice and generally considered acceptable to analyze ordinal parameters with four or more levels, as in a Likert scale.1,2,3 In this study, the averages and standard deviations over the range of the eight subjects, and over the range of the noise factors, were treated as continuous parameters using the design of experiments (DOE) analysis and the response optimizer available with Minitab software. The optimization approaches used included:
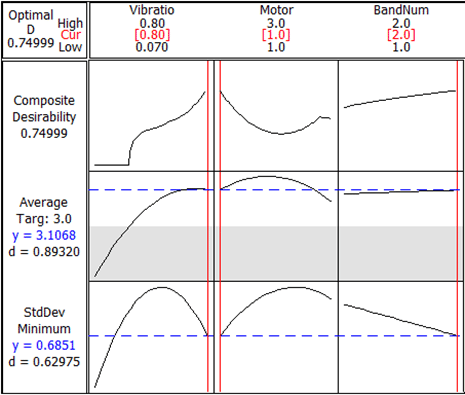
- Co-optimization of the mean and standard deviation (target of the mean is 3, standard deviation to be minimized) (Figure 5)
- Maximization of the capability index Cpk (upper specification limit = 4, lower specification limit = 2) (Figure 6)
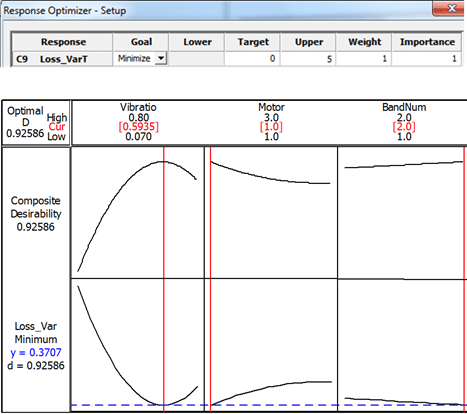
- Minimization of the loss function ([mean-target]2 + variance) (Figure 7)
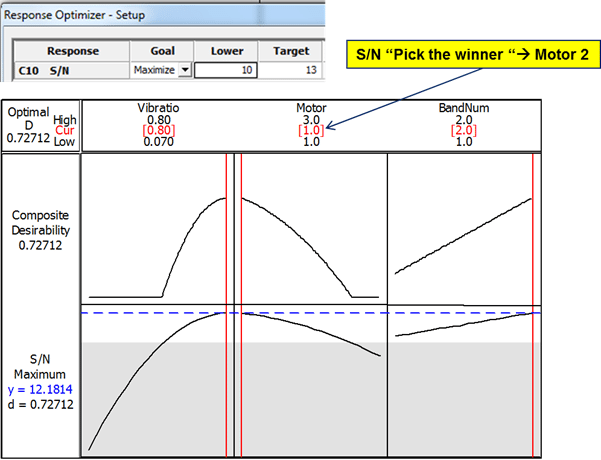
- “Pick the winner” signal-to-noise (S/N) ratio (finding the treatment combination that had the highest S/N ratio)
- Maximization of the S/N ratio (using S/N ratio target is best) (Figure 8)
- A comparison of the results from these approaches is provided in the table below.

| Comparison of the Results of Optimizations Using Different Criteria for Optimization | |||
| Optimizing | Vibration | Motor | Band Number |
| Mean and Standard Deviation | 0.8 | 1 | 2 |
| Cpk | 0.6 | 1 | 2 |
| Loss Function | 0.6 | 1 | 2 |
| S/N – Pick the Winner | 0.8 | 2 | 2 |
| S/N Optimized | 0.8 | 1 | 2 |
With sequential experimentation, the study was continued with 14 subjects, varying the motor placement (neck or collar), vibration strength and activity. The results of that study were used with Monte Carlo simulation to assess the user experience and fine-tune the settings for optimal experiences (Figure 9).
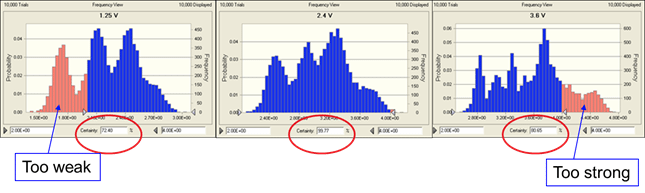
Monte Carlo simulation using the results and equation derived empirically predicted that the optimized settings will result in 99.77 percent of user experiences falling within the range of 2 (a little weak) to 4 (a little too strong) on the Likert rating scale of 1 to 5.
Conclusion
Ordinal logistic regression and a variety of robust design optimization approaches were used to optimize the design decisions for a proposed new product in which subjective responses were evaluated using a Likert scale. This analysis results in an optimized design that the potential customers found pleasant in providing tactile haptic sensory inputs.
The effort generated interest in further pursuit of the project as a joint venture between two companies.
References
1. Babakus, E, Fergnson, CE and Joreskog, KG, (1987). The sensitivity of confirmatory maximum likelihood factor analysis to violations of measurement scale and distributional assumptions. Journal of Marketing Research, 24, 2228.
2. Dolan, CV (1994), Factor analysis of variables with 2, 3, 5, and 7 response categories: A comparison of categorical variable estimators using simulated data. British Journal of Mathematical and Statistical Psychology, 47, 309-326.
3. Hutchinson, SR and Olmos, A (1998). Behavior of descriptive fit indexes in confirmatory factor analysis using ordered categorical data. Structural Equation Modeling: A Multidisciplinary Journal, 5, 344-364.