This three-part case study focuses on improving customer satisfaction at two of the company’s diagnostic clinics – Centers A and B. In Part One, the company worked at Center A to reduce patient turnaround time, a defining component of patient satisfaction. In Part Two, the chain’s improvement story focuses on increasing patient delight at Center B. In Part Three, the story returns to Center A.
During one of the meetings held during Part One of this case study, when progress was becoming apparent, one of Center A’s doctors remarked: “You must help us in the laboratory; the internal processes leave a lot to be desired.” At this point the laboratory had already reduced the number of patients waiting for blood sample collection by 70 percent as follows:
|
Before |
After |
|
|
Average |
14 |
5 |
|
Average + 3σ |
30 |
9 |
What, then, was the problem?
Defining the Problem
 Brainstorming and discussion revealed that while the queues had been dramatically reduced for sample taking, the front office still dealt with patient discontent from delays when the patients collected the test reports. This was corroborated by the pareto analysis of Center B in Part Two (Figure 2) of the case study, where waiting for reports was the second highest customer complaint about Center B – 14 percent of total complaints.
Armed with this knowledge, the team embarked upon a project to reduce the turnaround time of lab reports.
Applying a Method
The team applied Lean techniques to this project as follows:
- Map the current-state process
- Measure:
- Arrival patterns
- Time to process at each stage of the process
- Deployment pattern of people, equipment
- Develop the future-state process map while applying the following techniques to reduce WIP and, in turn, turnaround time:
- Converting the process from a batch to a flow process
- Reducing non-value-added stages
- Balancing the line (i.e., ensure capacity available can process arrivals at the required speed)
Assessing the Current State
The current-state process is shown in Table 1.
| Table 1: Current-state Process for Generating Lab Reports | ||||
|
Step Number |
Task Type | Task Undertaken By | Unit (Patient vs. Batch) | When Step Handled |
|
1 |
Take blood sample | Technician 1 | Patient | When technician has time |
|
2 |
Deliver sample to lab | Technician 1 | Batch | When technician has time |
|
3 |
Test | Technician 2 | Batch | When equipment reaches capacity |
|
4 |
Write results on worksheet | Technician 2 | Batch | When technician has time |
|
5 |
Provide hand-written results to typist | Technician 2 | Batch | As directed by typist |
|
6 |
Type report | Typist | Batch | When typist has time |
|
7 |
Verify report accuracy | Technician 2 | Batch | When technician has time |
|
8 |
Review and sign report | Doctor (original doctor patient saw) | Batch | When doctor has time |
|
9 |
Give report to typist | Doctor | Batch | When doctor has time |
|
10 |
Finished report sent to a central point where all reports are collected and handed to patient | Typist | Batch | When typist has time |
WIP was collecting at every stage as work was processed and moved to the next stages only when convenient to the staff member performing the task. From these observations, it was apparent that random batching was the cause of a large part of the turnaround time of individual reports. Compounding the problem, the batches (of typing, checking, correcting, signing and issuing the reports) were grouped toward the late afternoon and evening; many reports were not ready for patients until the next morning – and sometimes even the next afternoon. In rare instances, some reports took two days to complete (i.e., be ready to be handed to the patient).
Once this process was mapped, the team set a goal of getting reports to patients between 7 p.m. and 8 p.m. of the same day if their blood sample tests were completed before 4 p.m.
Creating the Future State
As the first step in creating the future-state map, the team examined equipment batching issues, and determined the capacity levels of that equipment and associated personnel. These items are summarized in Table 2.
| Table 2: Future-state Mapping Results | ||||||
| Equipment | Number of Machines | Number of Racks* | Number of Batches | Minutes | Report Preparation | Technician |
| Biochemistry | 2 | 4 | Per rack | 60 |
|
A |
| Biochemistry (semi-automated) | 2 | N/A | 1 | 5 | Print out | A |
| Electrolyte | N/A | N/A | 1 | 3-5 | Print out | A |
| Glycosolated | N/A | N/A | 1 | 10 | Manual | A |
| Immunology | 1 | Belt fed | Continuous | 60 |
|
B |
| ESR | 1 | N/A | 20 | 25 | Print out, interface | C |
| Cell Counter | 1 | Automatic | 1 | Fast |
|
Doctor |
| Elise | 1 | N/A | 1 | 120 | Print out | C |
| Electrophoresis | N/A | N/A | 1 | 120 | Report ready immediately | C |
| Urine | 1 | N/A | 1 | 10 | Manual, print out | D |
| Microbiology | 1 | N/A | 1 | Days | Results take five days | E |
| Staining | N/A | N/A | 1 | Days | Results take five days | C, D |
*A tray that takes a batch of tubes with blood samples for loading into a machine
Ninety percent of all tests fell in either category 1 or 4 (i.e., biochemistry or immunology tests performed on automated machines). Based upon the possible configurations, a repeatable cycle of 60 minutes was selected as the optimum performance level. The question was: Could the tests of all samples collected in an hour (e.g., between 9 a.m. and 10 a.m.) be completed in the next hour (i.e., between 11 a.m. and 12 p.m.) and reports issued in the next 60 minutes (i.e., between 12 p.m. and 1 p.m.)?
The arrival pattern of samples was observed for three days during peak times and is shown in Table 3.
| Table 3: Blood Sample Arrival Patterns | ||||||||
| Test Type | Number of Samples | Cycle Time Per Batch (Minutes) | Samples/ Batch | Batches/ Hour/ Technician | Average Load/Hour | Technician | ||
|
Day 1 |
Day 2 |
Day 3 |
||||||
| Biochemistry |
7 |
9 |
13 |
60 |
24 |
2 |
10 |
A |
| Electrolyte |
0 |
1 |
2 |
3-5 |
1 |
4 |
1 |
A |
| Immunology |
5 |
7 |
7 |
60 |
Continuous |
2 |
7 |
B |
| Elise |
1 |
2 |
0 |
120 |
1 |
1 |
1 |
C |
| ESR |
6 |
8 |
3 |
30 |
20 |
3 |
6 |
C |
| Cell Counter |
6 |
8 |
6 |
1 |
Automatic |
4 |
7 |
C |
| Totals |
25 |
35 |
31 |
32 |
||||
Based on these observations, it appeared feasible to be able to complete the testing of all samples received within 60 minutes. Report preparations and signing/approval were also timed, and the 60-minute timeframe was still doable if the testing results were communicated – and the reports passed on – for approval in a flow pattern rather than in batches.
Running a Trial of the New Process
The green channel run method (all samples collected in an hour) was selected to test these hypotheses. The minimum batch sizes selected, hourly batches, were run without waiting at any stage to see if the reports could be completed in the next two hours. All the personnel in the processing chain were briefed for the trial.
Based on the results, it was determined that for all tests which took less than two hours to complete reports could be issued within that two-hour timeframe. This improved turnaround time would affect more than 90 percent of the patients visiting the clinic and would easily meet the goal set by the team earlier in the project (getting reports to patients between 7 p.m. and 8 p.m. of the same day if their blood sample tests were completed before 4 p.m.).
The longer tests (e.g., microbiology for which the results took a few days to become available) would continue to take longer. Luckily, those tests were infrequent, and patients would be told to expect the reports after the longer appropriate timeframe.
The new cycle for processing tests and reports was run for longer and longer durations each day as any glitches were worked out and the staff gained confidence in the new process. Ultimately it became the default process for each day and proved to be highly effective and popular among the staff – it finished the work and left minimal WIP, relieving pressure on all clinic employees.
Measuring the Results
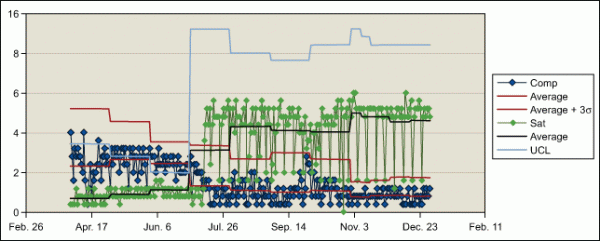
The improved process was implemented across the center; the results are evident in the improvements shown in the figure below.

The average number of satisfied customers increased from 10 to 12 per day while the complaints dropped from 2.7 to 2 per day. This was attributed to the reduced time patients spent waiting for reports.
Conclusion
This case study features four important items for consideration regarding customer satisfaction in healthcare:
- Customer delight consists of big things and small things – and the small things are big. In diagnostic clinics, the “big thing” is the quality of testing. Customer delight, however, comes from all the “small” peripherals that make up the total customer experience.
- Voice and observations of the customer are critical to success in any industry, and certainly in healthcare.
- Fool-proofing processes, reducing waiting time through flow, eliminated unnecessary steps and other tools of just-in-time manufacturing are just as important in medical organizations as in any other field.
- The medical profession needs to understand the importance of what makes up customer satisfaction and that working in silos often results in avoidable problems for customers.