The Emergency Department (ED) increasingly is becoming the sole source of medical care for many individuals. It also is often called the “gateway” to the hospital since it is the first encounter many patients have with the hospital. Thus it is the place where positive or negative perceptions of the hospital initially may be formed.
North Shore University Hospital in Forest Hills, N.Y., addressed this issue by initiating a Six Sigma project aimed at improving the patient experience in its Emergency Department. The project team took on the problem of excessive wait times in the ED while struggling at the same time with rising healthcare costs and increasing volumes of patients. The results have been impressive.
North Shore University Hospital is a 302-bed community hospital located in Queens. It is one of 18 hospitals which are part of the North Shore-Long Island Jewish Health System, the third largest non-profit, secular health system in the country. North Shore University Hospital is unique in that there are three other competing hospitals within a three-mile radius. Its wait time project was begun in 2003 as part of a system-wide improvement initiative which started more than two years ago.
Through data collection and analysis, the hospital’s project team found that the average cycle time for treat and release, walk-in ED patients was more than three hours. As a result of the project, improvements were made to the Emergency Department process that not only decreased cycle times, but also raised patient satisfaction.
The following are some of the findings, solutions and results as the team went through the DMAIC process:
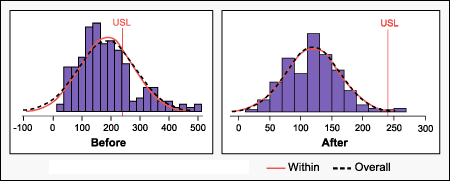
- Statistical analysis using Six Sigma methodology revealed that the average cycle time for an ED treat-and-release, walk-in patient was 187 minutes, with a standard deviation of 97 minutes.
- At every stage of the process, patients’ charts were “stamped” in a time clock so that the team could track patients from the time they walked in until a physician discharged them.
- The data from the stamped charts was segmented into five categories:
- Arrival to triage
- Triage to registration
- Arrival to seen by physician
- Seen by physician to discharge
- Arrival to discharge
- Primary factors of delay in treating patients were the registrar on duty and the “batching” of charts by the registration staff. The physician on duty also seemed to be a major source of variation in the process.
- The team utilized Six Sigma tools and process improvement steps to improve the patient flow process.


- Improvements resulted in a decrease in wait time by 37 percent, from 187 minutes to 118 minutes (Figure 1). The standard deviation decreased by 50 percent.
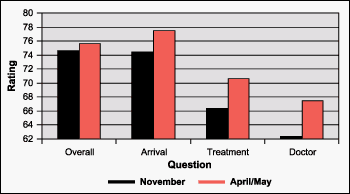
- Patient satisfaction (as measured by Press Ganey Associates) also improved (Figure 2):
- Overall Emergency Department scores increased by 1 point
- Noticed-by-someone-at-arrival scores increased by 3.1 points
- Time-to-treatment-area scores increased 4.2 points
- Time-to-see-physician scores increased 5.4 points

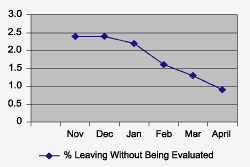
- The sigma score increased from 2.0 to 4.1. And the number of patients who left without being evaluated dropped by 50 percent. (Figure 3)
Summary and a Lesson Learned
The team was pleased with the results of the project. Patient satisfaction scores continued to increase and the environment in the Emergency Department changed. With time freed up by significantly decreasing wait times for treat-and-release patients, in-patient admissions also were handled more quickly. Those patients reached the appropriate units of the hospital faster.
At the beginning of the project, all involved said that the Emergency Department was understaffed. There were not enough nurses, physicians, ancillary help and registrars. The team members also initially thought that staffing was a major issue. But after many conversations and long days crunching numbers, the team decided to trust the process and see what the data had to say. Much to the team’s surprise, the data revealed the problem was not a staffing issue but a process issue.
Once the appropriate changes were made to the process, staff members were not only seeing more patients, but enjoying their work more. Sick calls from the physicians and the nursing staff went down. When asked what changed in the department, many staff members said that the tension was removed. People enjoyed coming to work and patients had shorter, more pleasant stays while in the Emergency Department…all with the same number of positions in the department as when the project began.