Since 2001, Thibodaux Regional Medical Center (TRMC) in Louisiana has applied Six Sigma and change management methods to a range of clinical and operational issues. One project that clearly aligned with the hospital’s strategic plan was an initiative to reduce nosocomial or hospital-acquired pressure ulcers, because this is one of the key performance metrics indicating quality of care.
Although the pressure ulcer rate at the medical center was much better than the industry average, the continuous quality improvement data detected an increase between the last quarter of 2003 and the second quarter of 2004.
In October 2004, a Six Sigma project to address this issue was approved by the hospital’s senior executives. A team began to clarify the problem statement. Their vision was to be the “Skin Savers” by resolving issues leading to the development of nosocomial pressure ulcers. The project team included a Black Belt, enterostomal therapy registered nurse (ETRN), medical surgical RN, ICU RN, rehab RN and RN educator.
Scoping the Project
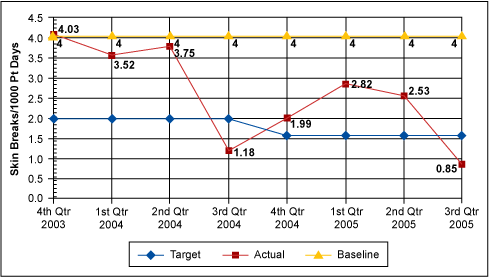
Through the scoping process, the team determined that inpatients with a length of stay longer than 72 hours would be included, while pediatric patients would be excluded. The project Y was defined as the nosocomial rate of Stage 2, 3 and 4 pressure ulcers calculated per 1,000 patient days. Targets were established to eliminate nosocomial Stage 3 and Stage 4 pressure ulcers and reduce Stage 2 pressure ulcers from 4.0 to less than 1.6 skin breaks per 1,000 patient days by the end of the second quarter of 2005.
The team developed a threats and opportunities matrix to help validate the need for change (Table 1). They encountered some initial resistance from staff, but were able to build acceptance as the project began to unfold.
| Table 1: Threats and Opportunities Matrix | ||
| Threat | Opportunity | |
| Short Term | Increase length of stay | Improve quality of care |
| Increase costs | Decrease medical complications to patient | |
| Increase medical complications to patient | ||
| Long Term | Decrease patient satisfaction | Improve preventative care measures |
| Increase morbidity rate | Improve hospital status/image | |
| Decrease physician satisfaction | Increase profitability | |
| Increase number of lawsuits | Improve customer satisfaction | |
| Decrease reimbursement | ||
| Loss of accreditation | ||
Measurement and Analysis
During the Measure phase, the team detailed the current process, including inputs and outputs. Using cause and effect tools, process steps having the greatest impact on the customer were identified as opportunities for improvement. The team also reviewed historical data and determined that overall process capability was acceptable, but that the sub-processes had a great deal of room for improvement. Improving these sub-processes would positively affect the overall process and further improve quality of care.
Measurement system analysis on the interpretation of the Braden Scale was performed to verify that results obtained by staff RNs were consistent with the results obtained by the enterostomal therapy RN, because this is the tool used to identify patients at risk of developing a pressure ulcer. This analysis indicated that the current process of individual interpretation was unreliable and would need to be standardized and re-evaluated during the course of the project.
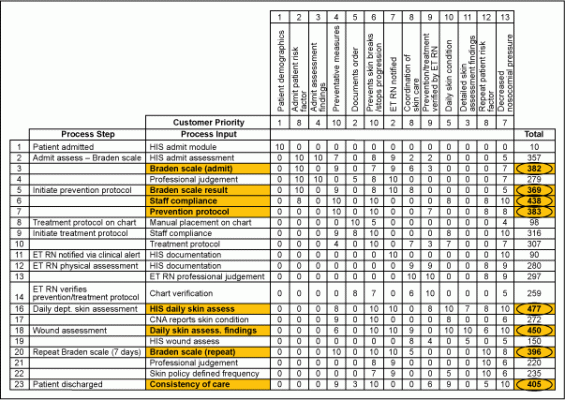
A cause and effect matrix was constructed to rate the outputs of the process based on customer priorities and to rate the effect of the inputs on each output (Figure 1). The matrix identified areas in the process that have the most effect on the overall outcome, and consequently the areas that need to be focused on for improvement (Table 2).
The team identified several critical Xs affecting the process:
- Frequency of the Braden Scale – The Braden Scale is an assessment tool used to identify patients at risk of developing pressure ulcers. Policy dictates how frequently this assessment is performed.
- Heel protectors in use – Heel protectors are one of the basic preventative treatment measures taken to prevent pressure ulcers.
- Incontinence protocol followed – Protocol must be followed to prevent against constant moisture on the patient’s skin that can lead to a pressure ulcer.
- Proper bed – Special beds to relieve pressure on various parts of the body are used for high-risk patients as a preventative measure.
- Q2H (every two hours) turning – Rotating the patient’s body position every two hours is done to prevent development of pressure ulcers.
| Table 2: Data Analysis | ||||
|
Process |
Defects |
Opportunities |
% Defective |
Z Score |
|
Overall Process |
64 |
16,311 |
0.39 |
2.66 |
|
Braden Scale Frequency |
10 |
76 |
13.16 |
1.12 |
|
Proper Bed |
24 |
76 |
31.58 |
0.48 |
|
Q2H Turning |
49 |
76 |
64.47 |
-0.37 |
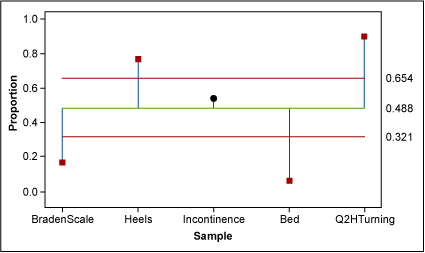
Data analysis revealed that the bed type was not a critical factor in the process, but the use of heel protectors, incontinence protocol compliance, and Q2H turning were critical to the process of preventing nosocomial pressure ulcers. The impact of the Braden Scale frequency of performance was not identified until further analysis was performed (Figure 2).
Evaluating data specific to at-risk patients, the team separated populations who developed nosocomial pressure ulcers from those who did not have skin breakdowns. The Braden Scale result at the time of inpatient admission from each population was analyzed to see the effect on development of a nosocomial pressure ulcer. One unexpected finding was that the admit Braden Scale result was higher for patients who develop nosocomial pressure ulcers than for those who do not develop them, showing that patients at risk are not being identified in a timely manner, thus delaying the initiation of necessary preventative measures.
The team then looked at defects for Braden Scale frequency of performance for each population of patients using a chi square test. They found the frequency of Braden Scale performance did have an effect on the development of nosocomial pressure ulcers. This was confirmed with binary logistic regression analysis (Table 3).
| Table 3: Binary Logistic Regression Analysis | ||||
| Process |
Coefficient |
Odds |
Probability |
Odds Ratio |
|
No Defects |
–0.5222 |
0.59 |
0.37 |
N/A |
|
Braden Scale Defects |
2.54322 |
7.55 |
0.88 |
12.72 |
|
Bed Defects |
1.56220 |
2.83 |
0.74 |
4.77 |
|
Q2 Turn Defects |
–2.16870 |
0.07 |
0.07 |
0.11 |
The most significant X is the Braden Scale frequency of performance. This analysis confirmed the need to increase the frequency of Braden Scale performance to identify at-risk patients.
Recommendations for Improvement
During the Improve phase, recommended changes were identified for each cause of failure on the FMEA with a risk priority number of greater than 200. Some of the recommendations include:
- Frequency of Braden Scale performance to be increased to every five days
- Braden Scale assessment in hospital information system (HIS) to include descriptions for each response
- Global competency test on interpretation of Braden Scale to be repeated annually
- Prompts to be added in HIS to initiate prevention/treatment protocols
- ET Accountability Tracking Tool to be issued for non-compliance with prevention and treatment protocols as needed
The Braden Scale R&R was repeated after improvements were made on the interpretation of results. The data revealed an exact match between RNs and the ETRN 40 percent of the time, and RNs were within the acceptable limits (+/– 2) 80 percent of the time. Standard deviation was 1.9, placing the results within the specification limits. The data indicated that the RNs tend to interpret results slightly lower than the ETRN, which is a better side to err on because lower Braden Scale results identify patients at risk of developing pressure ulcers.
The Control Phase
Another round of data collection began during the Control phase to demonstrate the impact of the improvements that had been implemented. A formal control plan was developed to ensure that improvements would be sustained over time, and the project was turned over to the process owner with follow-up issues documented in the Project Transition Action Plan.
The team implemented multiple improvements, including compilation of a document concerning expectations for skin assessment with input from nursing and staff. They also gave a global competency test on interpretation of the Braden Scale, which will be repeated annually. The Braden Scale frequency was increased to five days, and they corrected the HIS calculation to trigger clinical alerts for repeat of the Braden Scale. Prompts were added for initiating the Braden Scale, and monthly chart audits were developed for documentation of Q2H turning. A turning schedule was posted in patient rooms to identify need and document results of Q2H turning of patient. Additional solutions included the following:
- ETRN to attend RN orientation to discuss skin issues
- Revise treatment protocol to be more detailed
- Wound care products to be reorganized on units
- Unit educators to address skin issues during annual competency testing
- CNA and RN to report at shift change to identify patients with skin issues
- Task list to be created for CNAs
- ET accountability tracking tool to be issued for non-compliance with prevention and treatment protocols as needed
Results and Recognition
Since this was a quality-focused project, the benefits are measured in cost avoidance and an overall improved quality of care. A 60 percent reduction in the overall nosocomial pressure ulcer rate resulted in an annual cost avoidance of approximately $300,000.
To make sure their initiatives are producing a positive impact on the patient care environment, the hospital continuously measures patient and employee satisfaction through Press Ganey. Inpatient satisfaction is consistently ranked in the 99th percentile and employee satisfaction in the 97th percentile. TRMC also has received recognition in the industry for their achievements, including the Louisiana Performance Excellence Award for Quality Leadership (Baldrige criteria), Studer Firestarter Award and Press Ganey Excellence Award.
“This project is a perfect example of the need to verify underlying causes using valid data, rather than trusting your instincts alone,” said Sheri Eschete, Black Belt and leader of the pressure ulcer project at TRMC. “Six Sigma provided us with the tools to get to the real problem so that we could make the right improvements. There had been a perception that not turning the patients often enough was the issue, but the data revealed that it was really the frequency of the Braden Scale. Leveraging the data helped us to convince others and implement appropriate changes.”
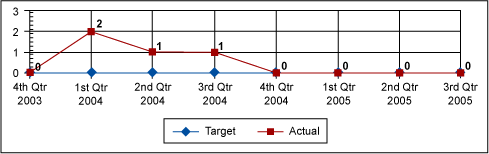
The nosocomial pressure ulcer rate is monitored monthly as one of the patient-focused outcome indicators of quality care. The results are maintained on the performance improvement dashboard (Figures 3 and 4).