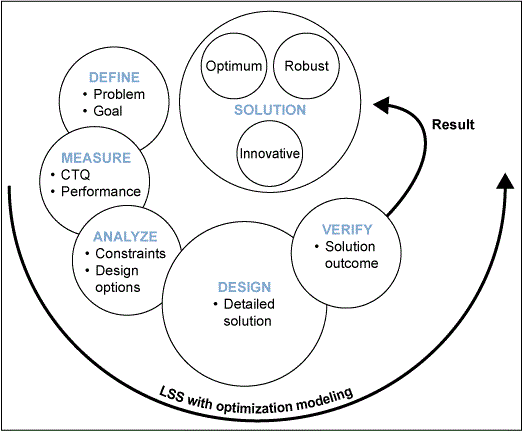
My company benchmarked against other manufacturing businesses before starting its cultural transformation change. They formed a team and visited companies including Toyota, GM, Milliken, Caterpillar, John Deere, Chrysler, Du Pont and Johnson Controls. After talking to each company about their cultures and continuous improvement processes, my company started to put together a roadmap for transformation. After changes in leadership, the company downsized, plants closed and now it has started its journey through a Lean Six Sigma (LSS) culture transformation.
Getting Started
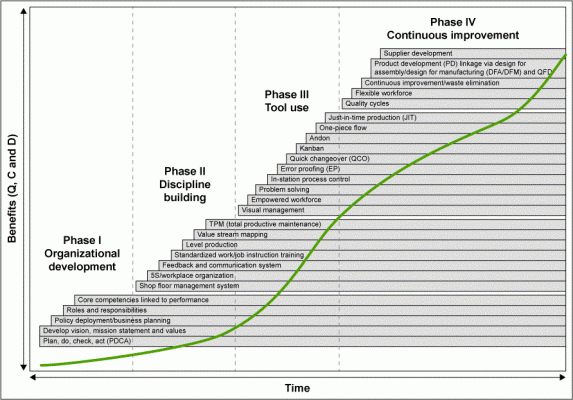
The business is going through cultural transformation in all of its plants. It is implementing a corporate strategy to support common continuous improvement thinking and language across the enterprise – laying the groundwork required for a sustainable continuous improvement culture. The business is using four phases in its continuous improvement rollout, as shown in Figure 1 below.
I. Foundation and the organizational alignment
II. Expansion and discipline
III. Integration and reinforcement
IV. Sustaining momentum
The Kansas City plant, my plant, has completed Phase II and is working its way through Phase III.
Training and Culture Change
The company sent all employees through a simulated work environment (SWE) where they assembled and disassembled wood cars on a real line using real tools and bolts. (This concept was taken from Caterpillar, which went through the same cultural transformation years ago.) This teaches everyone how to use some Lean tools and shows everyone how the team leads will be used in the new environment. During a two-day training, employees eliminated waste between the different runs, and watched their quality and delivery rates improve after each run. After SWE training, the team leads train the employees on what Lean tools are to be used and how to use them. The Lean tools being taught are: 5S, cyclical and non-cyclical standard work, total productive maintenance, quick changeover, inventory management, value stream mapping, error proofing, process problem solving, and Kaizen. The company provides an overview of the same tools to all employees so that they understand what team leads are trying to accomplish.
The plant located in Kansas City committed to more than 30,000 hours of training since starting its LSS journey.
The continuous improvement lead at the Kansas City plant was asked how important Lean Six Sigma is for implementing process improvements in manufacturing. He replied that the company’s employees work for its shareholders as a publicly traded company. LSS fits into the strategic pillar: growth, leadership development, continuous improvement and sustainability. The purpose of the LSS program is to develop a continuous improvement culture and mindset through people, processes and systems that enable best-in-class productivity, quality and time to market – all helping to create a better value for the customer. The following examples are a look at some of the ways in which my company is implementing process improvements.
Example 1: Continuous Improvement Waste Elimination
At my company, a tactical manufacturing engineer’s job is to work with the team leads and assist them with problem solving and implementing improvements. The engineers teach the team leads the tools they should use and what data to collect to make sure improvements are made. One project was the team lead’s Yellow Belt project – the redesign of the fender support cell. For his project he had to complete an A3 (a Lean tool for problem solving), which included a problem statement, future state conditions, current conditions and an implementation plan.
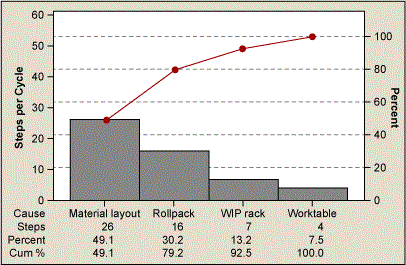
The team’s problem statement was that the fender support sub-assembly had 27.36 seconds of walk time in each cycle, which added up to 9.12 hours of walk time a week (474.24 hours annually), costing the company approximately $10,883 annually in non-value-added tasks. The team’s objective was to reduce walk time by 66 percent (18 seconds a cycle), freeing up more time for value-added tasks without negatively impacting quality. The team determined what area(s) to focus on by doing a pareto chart of the steps taken per cycle and looking at why the steps were necessary (see Figure 2). The team determined that locations of parts and materials were the main reasons for the high number of steps.
As a team they captured the current state layout and performed a spaghetti diagram to show the process flow of the sub-assembly area. Then they cut out all the material and equipment in the sub-area and played around with a layout for a new placement location for the future state. Improvements that were generated from this process included a smaller work table with a material rack built on the back of it, a new layout of the material rowpacks and a buffer table reduced from 48 pieces to 1 piece. Figure 3 presents the layout of the work station – before and after.
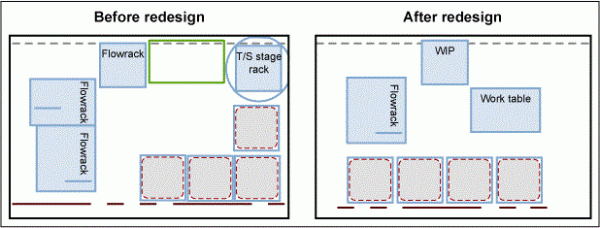
As a result of this new layout, the team reduced the walk time. The buffer reduction resulted in an increase of quality products – from 18 average defects per day down to nine. The work envelope was smaller and the Yamazumi board (another Lean tool) reflected a 18-second reduction in walk time. The new layout opened up 2,000 square inches of free space on the work floor. This was a good process improvement for the team and the line because it showed that substantial improvements can be made with just a little time and teamwork.
Example 2: O2 Sensors Causing High-Scrap Costs
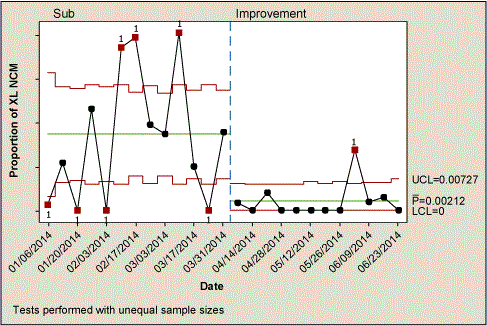
The first Green Belt project that I mentored was focused on a quality issue on some O2 sensors causing high scrap costs. From January 2, 2014, to March 31, 2014, the nonconforming material (NCM) for O2 sensors and exhaust pipes resulting from O2 sensors being stripped or cross threaded was 17,394 parts per million (PPM), which cost the company $29,552 annually. The improvements reduced the NCM for O2 sensors and exhaust pipes from 17,394 PPM to 2,253 PPM, an 87 percent improvement in performance, saving $26,689 annually.
Following DMAIC (Define, Measure, Analyze, Improve, Control) helped the project stay on track. The root cause of the problem was that the pipe thread quality was not being met, which caused cross-threading during assembly. There was also better capability if the operators hand started the O2 sensor before doing the final torque. The Green Belt candidate worked with the suppler to meet print specification on the threads which yielded the 87 percent improvement. Figure 4 presents a control chart showing the before-and-after data of O2 sensors stripped or cross-threaded.
Example 3: Addressing Ergonomics
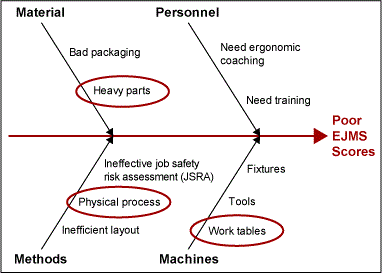
Six Sigma can also be followed when trying to reduce ergonomic scores. My company has an ergonomic score on every job performed. From January 24, 2013, to December 12, 2013, the handlebar sub-assembly stations had ergonomic job measurement system (EJMS) with room for improvement; the stations cost the company $131,492 annually. An unused sub-assembly carousel was repurposed to replace the work tables used to build the handlebars. This eliminated two major handlebar lifts as well as additional handling of the handlebars. EJMS was reduced an average of 27.5 percent, resulting in a cost avoidance of $108,393. Additionally, operator efficiency improved to support a volume increase of 30.4 percent, resulting in a $47,170 cost avoidance for 2014.
Ergonomics is a big part of assembly; any time improvements can be made to reduce ergonomic scores leadership is always on board. These projects can be difficult to implement because equipment can be expensive; repurposing equipment reduces those costs. This change was a big improvement for this line and helped with the efficiency of the operator. Since this has been implemented, we reduced the head count to two operators from three operators. This was due to the lower volume and the higher operator efficiency. This never would have happened if the conveyor was not implemented (Figure 5).
Example 4: Improving the Error-Proofing System
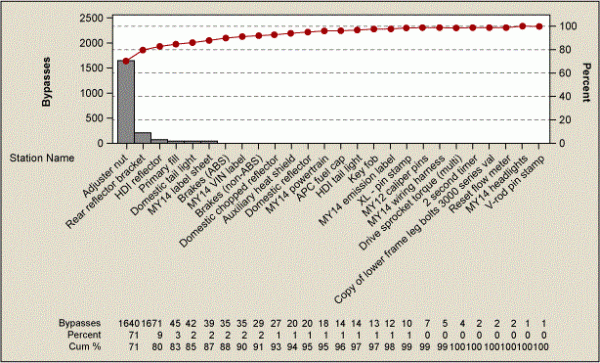
Another project addressed by a Green Belt candidate was improving the error-proofing system that the company uses on the assembly line. The issue was addressed from January 2, 2014, to January 24, 2014; the average number of assembly verification and information system (AVIS) station bypasses was 166 per day on the lines, which cost the company $77,522 annually. The improvement actions taken were to change and verify the configuration settings for the adjuster-nut AVIS station. The results reduced the number of AVIS bypasses from 43 percent defective (166/day) to 3.7 percent defective (22/day), saving $77,522 annually.
A pareto chart was performed on all the AVIS stations which helped the team focus on the one problem (Figure 6). After following the DMAIC methodology, the Green Belt candidate determined that the station configuration was incorrect and that the recipe program was incorrect. The candidate fixed these two issues and this problem was eliminated. The problem with this project is the sustainability of AVIS knowledge in the manufacturing engineering group. There are only two engineers who know how to program these AVIS stations and it is time consuming to train others on the process.
Discussion and Conclusion
As asked in The Toyota Way by Jeffrey Liker:
“What do we know about changing a culture?
1. Start from the top – this may require an executive leadership shakeup.
2. Involve from the bottom up.
3. Use middle managers as change agents.
4. It takes time to develop people who really understand and live the philosophy.
5. On a scale of difficulty, it is ‘extremely’ difficult.”
This is what I see at my current company. Enacting a change-improvement culture takes time, some leadership changes have occurred, the company lacks middle managers as change agents and change is extremely difficult.
Lean coupled with Six Sigma tools drive decision-making by data and metrics and provides a mechanism to quantify the potential for variation, defects and risk – as well as value-added and resource optimization before implementing actual changes.
Leadership must be involved in order to understand and communicate the importance of LSS and its deployment. Leadership must support a transformation and lead employees in the change. If projects are completed and the results are shared to the “non-believers,” a LSS implementation will be successful.
Middle management is focused on making improvements and ensuring bottom-line savings, which can lead to a need for lower staffing levels. This is a problem at my company not only with supervisors, but also with manufacturing engineers. They are doing the same amount of, or more, work as before with fewer middle-management employees. Middle managers can be overstressed and overworked, leading to increased turnover.
LSS is the future of current company and it will be a long journey to become fully implemented into the continuous improvement culture; however, LSS process improvements will help the company keep costs low, quality high and customer satisfaction high.