

Control Chart Wizard
Control Chart Wizard
Couldn't load pickup availability
Use Control Charts to improve reliability
--
Control Charts, also known as Shewhart charts, are used to study how a process changes over time. Control Charts are one of the seven basic tools of quality control.
When to Use a Control Chart:
• When controlling ongoing processes by finding and correcting problems as they occur.
• When predicting the expected range of outcomes from a process.
• When determining whether a process is stable (in statistical control).
• When analyzing patterns of process variation from special causes (non-routine events) or common causes (built into the process).
• When determining whether your quality improvement project should aim to prevent specific problems or to make fundamental changes to the process.
This Control Chart Wizard has a decision tree to help you figure out the type of data you have and how to build the right Control Chart, including all the formulas.
[caption id="attachment_17771" align="alignnone" width="1250"]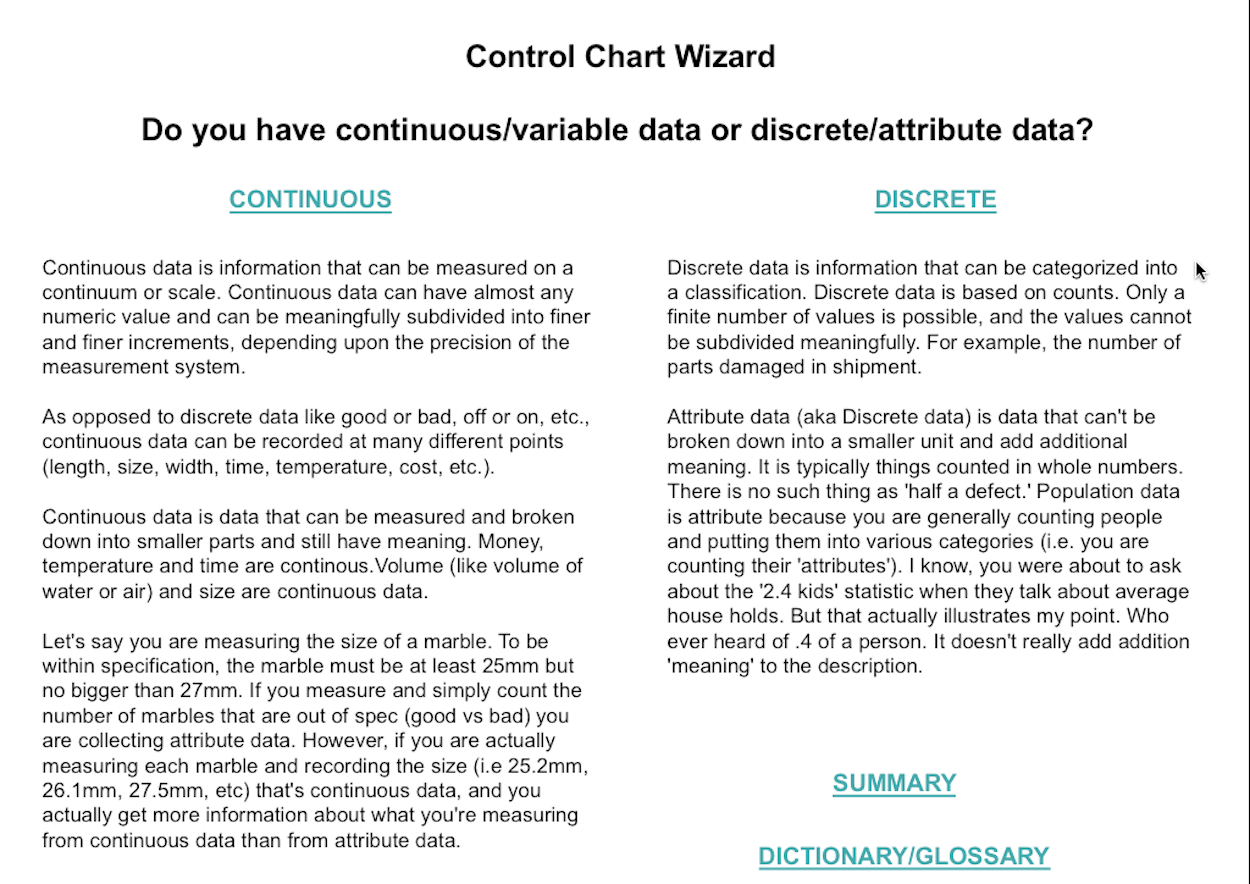 Sample image for tools[/caption]
Open Source Six Sigma
More products from iSixSigma