Difficulties can arise in any phase of a Lean Six Sigma process improvement project, but one issue often shows up early in projects using the DMAIC (Define, Measure, Analyze, Improve, Control) model. When Black Belts or Green Belts charged with running an improvement project reach the Measure phase, they are confronted with the question: What is the most effective and efficient way to identify the data needed and to perform analysis of the data during the Measure and Analyze phases of the DMAIC method?
Many alternatives are available, and new ones are being developed continually as Belts struggle with this problem.
The alternatives range from a basic fishbone analysis (not for root cause but to identify relationships) to a dart board analysis. In an attempt to reduce the variation of the tools, herein is proposed the “advanced data door worksheet.” What follows is an explanation of the worksheet and how it should be used.
Advanced Data Door Worksheet
The advanced data door worksheet serves many purposes. First, it helps identify the data that needs to be collected. Second, it provides a vehicle to track what questions about the data have surfaced and what the answers are based on the preliminary analysis performed during the Measure phase or more extensive analysis performed in the Analyze phasewhere hypothesis tests and regression analysis typically come into play.
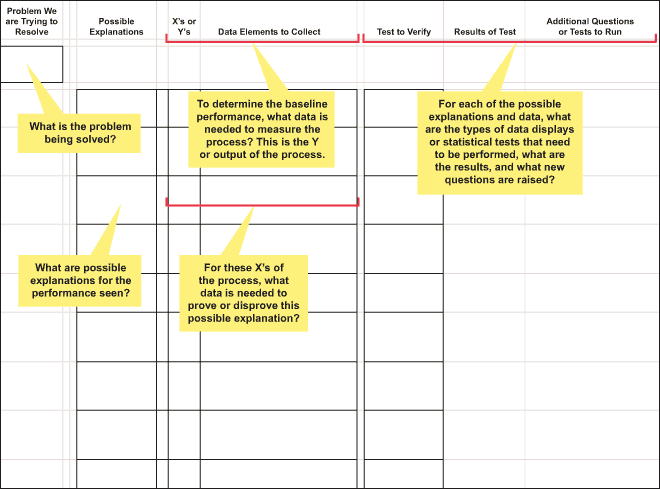
Figure 1 displays the worksheet in its initial form.

To demonstrate the worksheet’s value, it is best to utilize the worksheet for addressing a specific problem, thus showing the benefits of organizing not only a project’s data collection but also the analysis.
Example: Getting to Work on Time
Many people have a common problem – getting to work on time. Imagine for a moment, a newly trained Black Belt has to face a boss warning them that coming to work at a time suited for the Black Belt is unacceptable to the company, and the Belt must conform to the standard start time of 8 a.m.
First reaction of the Belt is to dispute the boss’s perception, but since they are now focused on using data, the Belt decides to collect data.
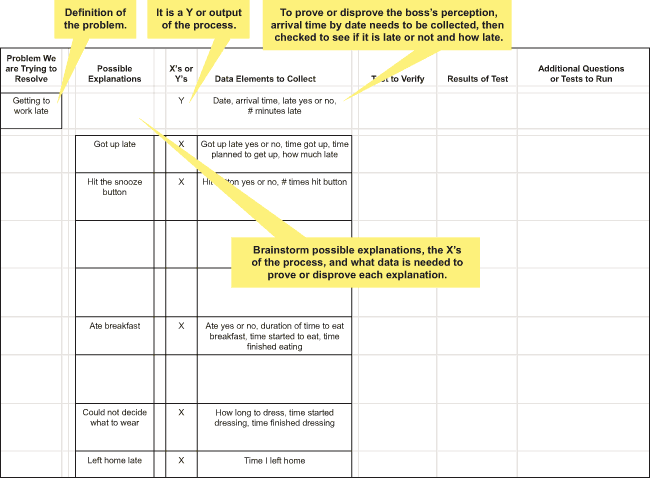
Using the advanced data door worksheet, the Belt sets up the left side of the sheet (Figure 2) to identify what data should be collected. Shown in the figure are some of the data elements needed to help the Belt verify whether or not the theorized explanations affect getting to work on time.

Data Collection and the Form
So that seems easy enough, right? Sure, if a Belt has people on the DMAIC team who are knowledgeable of the process, it is easy to come up with theories about how the process works and why it is not performing to the desired levels, but as part of the data door, the Belt needs data to prove it.
Now, the project requires the Belt to collect this data. In many instances, this data is not readily available. It will require people who are typically busy to do some additional work just to meet the Belt’s project, which they do not seem the least bit concerned about.
When asking for manual data collection, a Belt must keep the following points in mind:
- The person who must collect the data has a full-time job, which does not include collecting data for the Belt.
- The person collecting the data may not know about key elements of data collection, such as repeatability, reproducibility, precision, etc.
- The person collecting the data might do it, but they want to get it over with as soon as possible because it is a pain.
- To assure that the data collected is valid and can be used, the Belt must be engaged in the collection process and display appreciation for the people who are doing the collection. This means:
- Get their buy-in, then provide a data collection form with clear written instructions, including what to do with the form when completed and a place for their name and phone number.
- Check with them to assure that data collection is being done and done properly.
- Plan, using the advanced data door worksheet, to ask this of them only once.
- Stay involved. Pick up the completed forms daily, thank them for their efforts and ask if they have any ideas to make the data collection easier.
Now that the data is in hand, and it has been entered it into a computer for review, the question becomes: “What do we do with the data?”
Once the data has been collected (and assuming the appropriate measurement system analysis is performed), the Belt is now ready to perform some basic or advanced statistical tests to determine if these explanations are true or not. It is very common for even an experienced Belt to become overwhelmed and lost here. What often happens is that the Belt starts running various tests and after a period of time, does not remember what was done or what new questions were raised. In other words, through the many outputs, the Belt has lost the audit trail or logical trail of how the team got to the current conclusions.
Worksheet Helps Track Course
The advanced data door worksheet provides a vehicle to assist in keeping the Belt organized. As shown in Figure 2, the worksheet provides an area to list either the way a Belt might display the data or the statistical test the Belt would run to prove or disprove the explanation listed. In addition, as each test is performed, other questions might surface; therefore, an area is provided to list the question, and then the Belt can repeat the last two columns.
Returning to the example of getting to work late, Figure 3 shows the worksheet with the “test” column filled in.

Notice that, as in the case of the second explanation listed, there are a number of ways to test a theory depending on the type of data. If the Belt just wants to display results, a box plot could be used. This allows the worksheet to be a flexible tool. As the Belt completes these tests and determines the results, some additional questions may surface. They can be listed in the final column. These can either be run immediately or saved for a later date.
The important element in this part of the worksheet is the ability to continually expand the columns and rows thereby presenting a full picture of what tests were performed, what the results were and if the results led the Belt to additional cuts of the data.
If, as is typical in the Measure phase of DMAIC, hypothesis tests were not performed, this worksheet also provides the Belt with a record of what needs to be tested based on the preliminary results.
Summary: What Are Next Steps?
The final worksheet illustration (Figure 4) continues the analysis of the example’s simple problem of getting to work late.
As the results of each test are determined, Belts should determine what the next steps are or the next series of questions they want answered and continue to replicate the last two columns throughout all the analysis of the data. This provides a complete record of all the analysis and conclusions reached during the project.
