
If you collect all the possible process data that exists, you should be 100% confident you will be able to say something about your process. But, once you start taking samples, your confidence will start to drop because of sampling error and random chance. Let’s explore how you can use confidence level to describe the probability you can be comfortable in saying something about your process.
Overview: What is a confidence level?
It is usually not practical to collect all your process data. Therefore, you will take samples. The confidence level will be the percent of time you would expect repeated samples to approximate the first sample if you used the sample sampling technique from the same population.
If your confidence level is 100%, you will be 100% confident that repeated samples will provide approximately the same results. A confidence level of 0% means you have no confidence repeated samples will provide the same results. In most business applications, you will strive for a 90%, 95% or 99% confidence level.
The selection of confidence level is important because it impacts your sample size and confidence interval. The more confident you want to be, the larger your sample size will need to be. Likewise, the more confident you want to be, the wider your confidence interval.
An industry example of confidence level
A warehouse manager was looking over some data regarding shipping efficiency. She had collected data for the past month and wanted to understand what range of values might she expect if she started to collect sample data over time. Her Black Belt (BB) explained the concept of confidence interval and level. Below are her calculations.
She used the following formula to calculate a confidence interval for her current data and assumed a 95% confidence level.
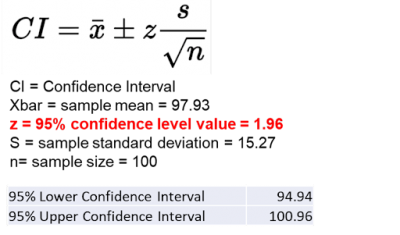
If the manager continued to collect data samples she could comfortably state she is 95% confident that 95% of future confidence intervals will contain the true population mean.
Frequently Asked Questions (FAQ) about confidence level
What is the difference between a confidence interval and confidence level?
A confidence interval is the range of values likely to contain a population parameter for a certain confidence level. It is calculated using the following formula:
Confidence Interval = (point estimate) +/- (critical value)*(standard error)
The confidence level is the percentage of all possible samples expected to include the true population parameter. The confidence level is used to select the appropriate critical value to use in the confidence interval formula.
What is a typical confidence level for business applications?
For critical applications, a 99% confidence level would be appropriate. For most other applications, 95% confidence would be acceptable and is often the default value used in most statistical software packages.
What does a confidence level mean?
A confidence level is the percentage of all possible samples expected to include the true population parameter. For example, assume multiple samples were selected from the same population, and a confidence interval was computed for each sample. A 95% confidence level would imply that 95% of the confidence intervals would include the true population parameter.