
How can you determine whether changes in your process have had a statistically significant effect? Can you just compare the average of your sample data before and after a change? Can you compare the sample averages of two vendors to determine whether one is doing better than the other? The answer is NO! Let’s see why.
Overview: What is a 2-Sample t-Test?
A 2-Sample t-Test is a hypothesis test used to determine if two population means are equal.
A 2-Sample t-Test uses the following null hypothesis:
- Ho: mu1 = mu2 (the two population means are equal)
The alternative hypothesis can be either two-tailed, left-one tailed, or right-one tailed:
- Ha: (two-tailed): mu1 does not equal mu2 (the two population means are not equal)
- Ha: (left-tailed): mu1 < mu2 (population 1 mean is less than population 2 mean)
- Ha: (right-tailed): mu1> mu2 (population 1 mean is greater than population 2 mean)
You can use the following formula to calculate the t test statistic:
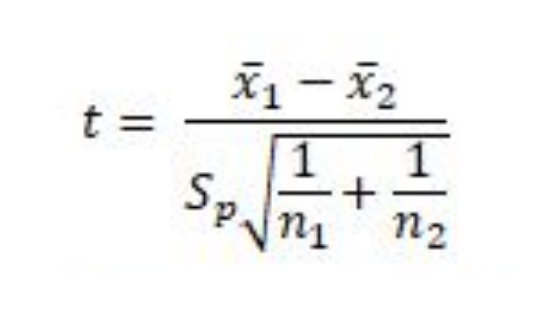
where xbar1 and xbar2 are the sample means, n1 and n2 are the sample sizes, and Sp is the pooled standard deviation calculated as:
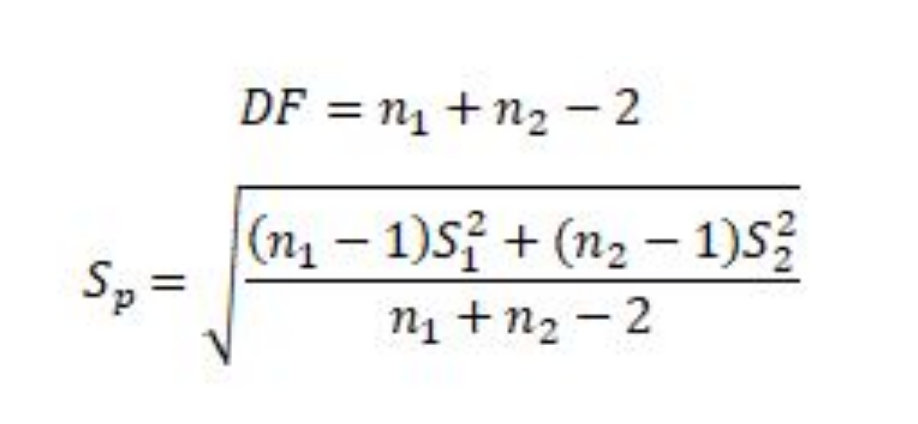
If the p-value corresponding to the test statistic t with (n1 + n2 – 2) degrees of freedom is less than your chosen alpha risk (common choices are 0.10, 0.05, and 0.01) then you can reject the null hypothesis thereby claiming there is a statistically significant difference in the means of the two populations from which the samples came from.
For the results of a 2-Sample t-Test to be valid, you will want to meet the following assumptions:
- Observations should be independent
- The data in each group should be approximately normally distributed
- The variance of each sample should be approximately equal
- The data should be randomly selected
An industry example of a 2-Sample t-Test
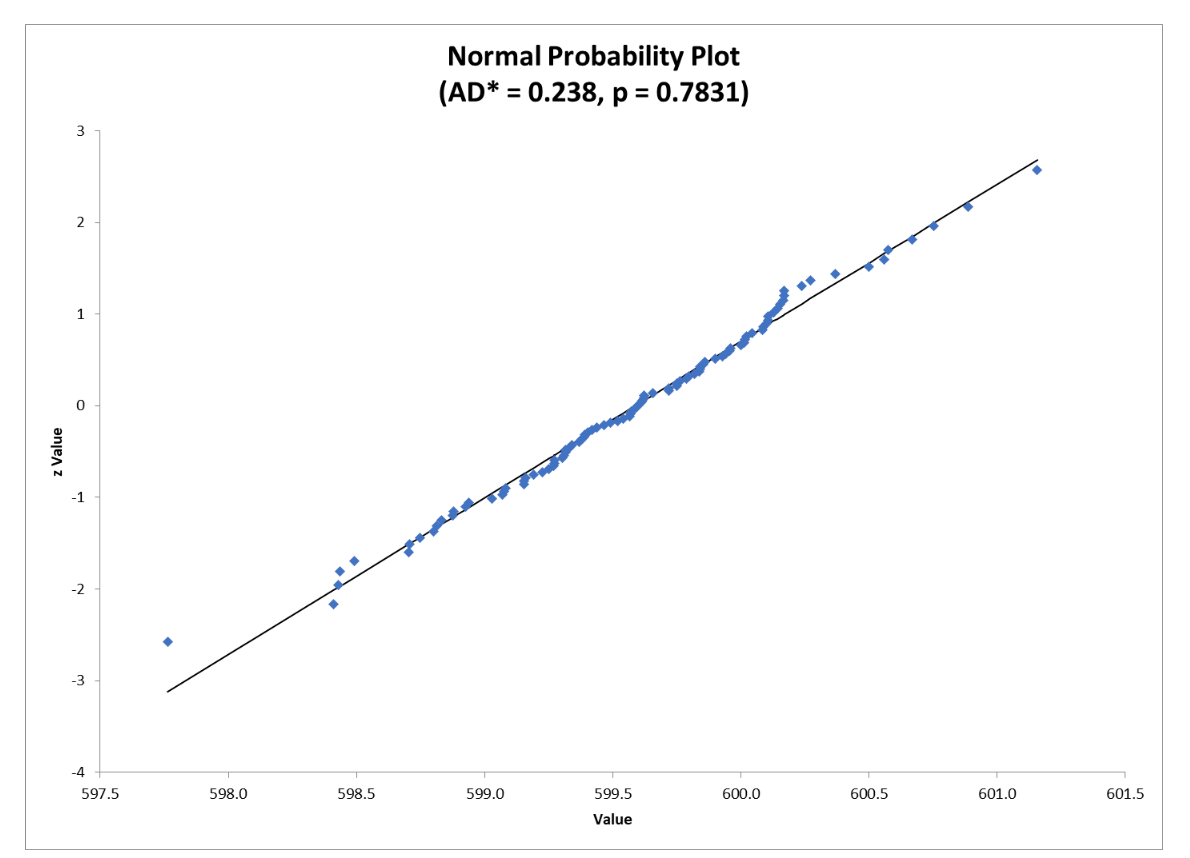
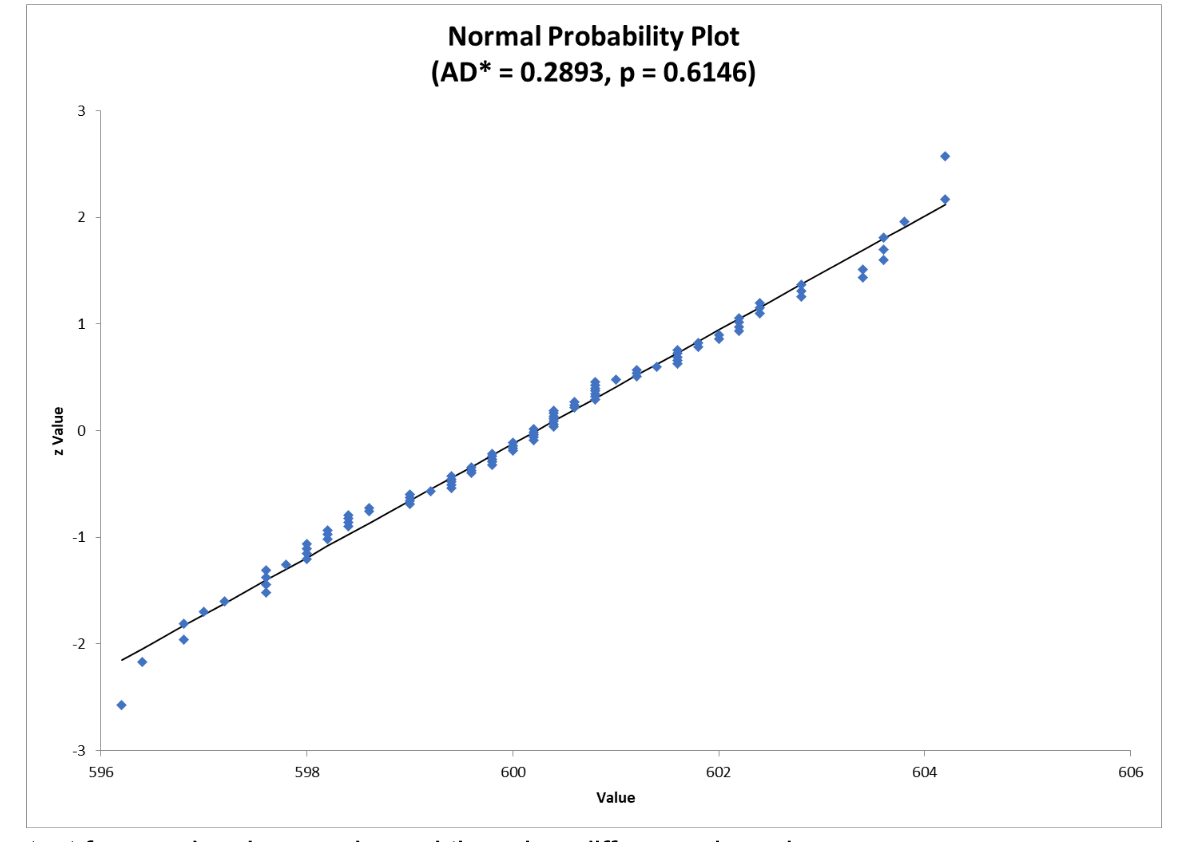
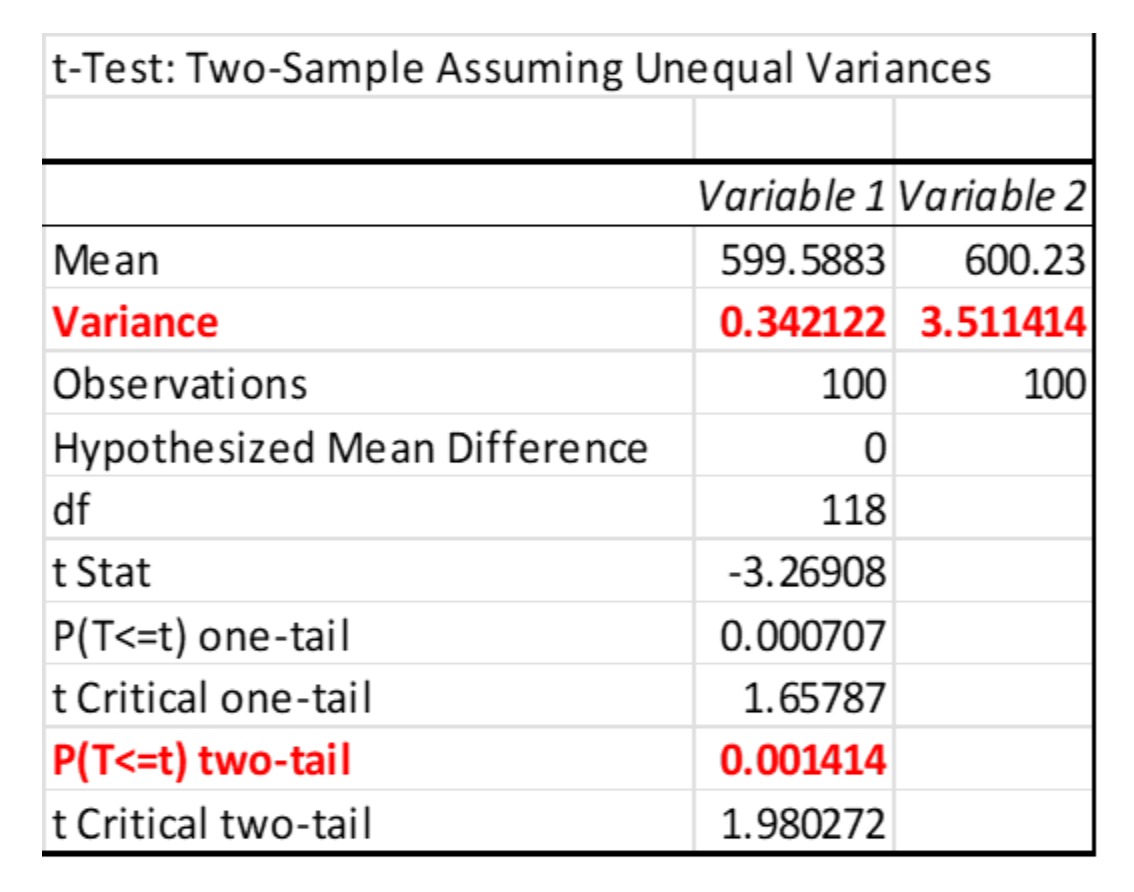
The lab manager was trying to compare the quality of test reagents being provided by two suppliers. She collected data from both and was advised by her company’s Six Sigma Master Black Belt to use a 2-Sample t-Test to see if they were providing an equal level of quality. Below are the results of her analysis.
Testing for normality shows both groups are not different than normal.
The test for equal variances showed there is a difference in variances.
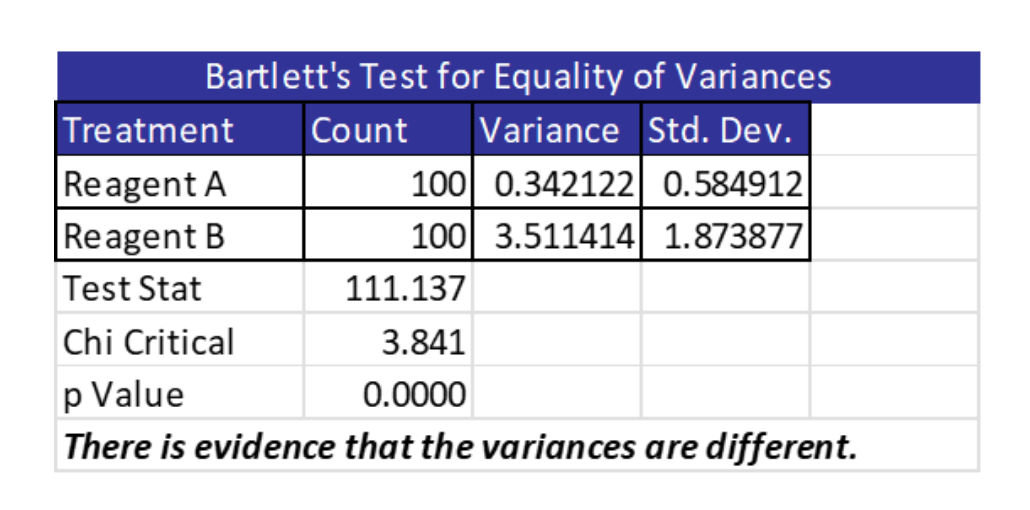
Since there was a difference in variances, the lab manager chose to use Welch’s test which is similar to the 2-Sample t-Test but does not require equal variances. She was able to do this in Excel. Note the actual values of variance and the low p-value which indicates you can reject the null hypothesis and claim there is a statistically significant difference in population means.
Frequently Asked Questions (FAQ) about a 2-Sample t-Test
Does a 2-Sample t-Test compare the means of two samples?
Not really. Just by simple arithmetic you know whether the means of the two samples are different. Since they are only samples, you really want to know if the population from which the two samples were drawn from are different or not. That is the purpose of the 2-Sample t-Test.
How strict is the assumption of normality for the 2-Sample t-Test?
The 2-Sample t-Test is robust to the assumption of non-normality as long as the shape of the distributions are relatively similar, symmetric and the sample size is relatively large..
What if I don’t meet the assumption of equal variances for my 2-Sample t-Test?
Then you should use the Welch’s test which also tests for equal means but does not require the assumption of equal variances.