
The concepts of bias, linearity, and Measurement System Analysis (MSA) are tied together. This article will discuss how bias and linearity are linked, how to measure and analyze linearity, and what it means for the quality of your measurement system.
Overview: What is linearity?
MSA, is a formal statistical study used to determine whether your measurement systems are capable of providing reliable data so you can make the best possible data-driven decisions. An MSA study, or Gage R&R, will assess a number of characteristics of your measurement. They are:
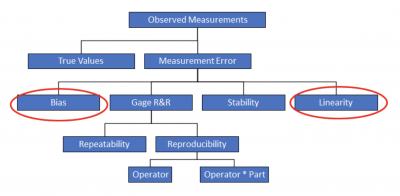
Note that both bias and linearity appear on the chart. You must understand bias before moving on to linearity. Bias is a consistent one-sided tendency of your measurement. For example, your scale always weighs half a pound more than your true weight.
Linearity is the ability of your measurement system to have a consistent bias over the entire range of possible measurements. What if you also used your scale to measure your pets, Ellie the elephant and Mickey the mouse? Would the same half-pound bias hold for all weights?
Probably not. Mickey doesn’t even weigh a half of a pound. Ellie’s weight will probably max out at the high end.

This will present you with a linearity issue since you want the scale to provide consistent measurement across the entire continuum of possible values.
Possible causes of linearity include:
- Poor calibration
- Poor maintenance
- Incorrect reference standard
- Temperature
- Humidity
- Cleanliness
Before starting your bias and linearity study, the process must be in statistical control and exhibiting common cause variation. You can do this by gathering measurements and comparing them to a reference standard, then plotting and interpreting the results on a control chart.
The key starting point is the selection of samples for the study. These samples must span the estimated range of measurement variation in the process. For example, if your process output varies from 100 to 150, you want to select samples that span that range. You don’t want to only include samples in the 120-130 range.
The steps for conducting a linearity study are:
- Select at least 5 samples where the range of values cover the possible range of process variation.
- Determine the reference value for each sample.
- Have one operator measure each sample at least 10 times using the current measurement system.
- Calculate the bias (actual measurement minus reference value) for each part.
- Calculate the average bias for each part.
- Plot the values on a chart.
- Compute a best fit line.
- Interpret the results.
This is what the output would look like:
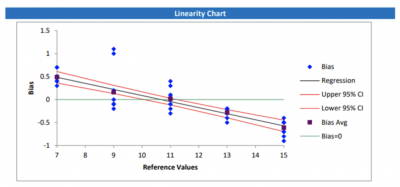
This is a plot of bias against the reference value. Also included is the best fit line. If this line is close to horizontal, then the average bias does not change across the parts. If the horizontal line is close to 0, then there is no significant bias. If the line is not close to horizontal, the bias may change across the reference values and you have a linearity problem with your measurement system.
In the example above, you can see the line is not horizontal nor at zero.
Your measurement goes from a positive bias to a negative bias as the values get larger. Bias indicates how close your measurements are to the reference values. A positive bias indicates your gage overestimates. A negative bias indicates your gage underestimates. In other words, your bias changes over the range of values. This is the definition of a linearity problem.
3 benefits of knowing about linearity
Linearity is a measure of your measurement system. Here are some of the benefits of knowing it.
1. Measure of your measurement system’s accuracy
Bias is a measure of your measurement accuracy. Linearity is how much that bias changes over the range of your process measurements.
2. Tells you about percent of variation
The statistical output of a linearity study will indicate what percent of the total variation is attributable to linearity.
3. Quality of your measurement system
Knowing whether you have linearity issues with your measurement system will help you determine whether you can trust your measurement systems for all values in your measurement range.
Why is linearity important to understand?
Linearity issues can detract from the reliability of your measurement system. It is important to know what linearity is telling you about your measurements.
Credibility of your measurement system
Any measurements resulting from a biased measurement system, along with linearity issues, will diminish the value and believability of the values you measure.
Provides a statistical basis
The output of a bias and linearity study will provide p-values to indicate whether the bias and linearity you see is really statistically significant.
Indicates bias problems
Excessive linearity in your measurement system indicates whether you have issues with a changing bias.
An industry example of linearity
An engineer working for a company producing several types of tubing with different diameters had a concern whether the measurement system used by the QC department had any bias. If there was bias, he was concerned whether the bias was constant or varied as a result of the different diameters.
The engineer decided to do a bias and linearity study using his statistical software. He selected 5 tube sizes with the following inside diameters: 0.25″, 0.5″, 1.0″, 1.5″, and 2.0″. He had a QC tech measure each tube 12 times to allow for the natural process variation to be accounted for.
The output and analysis of his study is presented below.
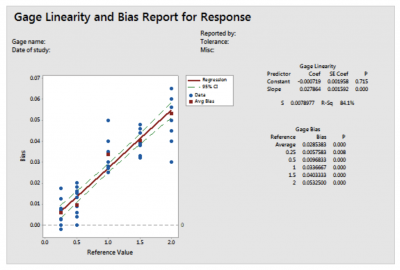
In all tube sizes, there was statistically significant bias (the p-value is less than 0.05 for all the reference sizes). For example, for the 1″ tube, the average bias is 0.0336667. This means on average, the diameter measurements are higher than the reference value. The bias increases with the tube diameter, as shown by the positive fitted line in the scatterplot. The inconsistency of the bias across the sizes indicates the measurement system also has linearity problems (p = 0.00).
As a result of the study, QC revised their testing and measurement protocols and acquired devices with greater resolution and accuracy.
3 best practices when thinking about linearity
Here are a few tips for conducting a linearity study.
1. Select samples which represent the full range of process variation
Since linearity is a measure of changing bias, you need to pick a wide range of samples to see if linearity exists over that total continuum of possible values.
2. Randomness
When measuring the samples, the test subject should measure them in a random order to overcome any bias caused by memory of previous measurements.
3. Use participants who normally do the job
To get a good picture of the process measurement system, you must mitigate and eliminate as much test noise as possible. Using test subjects who are familiar with measuring the samples you selected will reduce operator error and noise.
Frequently Asked Questions (FAQ) about linearity
1. What is linearity?
Linearity tells you how accurate your measurements (bias) are across your desired range of possible measurement values. It answers whether your gage has the same accuracy for the different size objects being measured.
2. What is bias?
Bias is the difference in values between a measured object and a reference value for the object. It can be positive or negative and indicates an underestimate or overestimate.
3. On a linearity chart, what does a negative slope mean for the fitted line?
It means the bias goes from positive to negative as the reference values get larger. A line with no slope means the bias doesn’t change over the range of measurements.
Final thoughts on linearity
A good measurement system will be repeatable, reproducible, stable, and accurate. Bias is the deviation of your measurement from a standard or reference value. It is your measure of accuracy. Linearity indicates whether the bias is constant across the entire range of possible values or changes as values get larger or smaller.