


Capability Analysis Course Training Slides
Capability Analysis Course Training Slides
Couldn't load pickup availability
Variation is the differences that exist between individual units of a product or process
--
Statistics and statistical techniques are a vital key to any world class organization.
However, statistics can be intimidating to many employees and managers. Although statistical training is widely available, if the knowledge is not used, it disappears quickly.
By downloading this presentation course, you will have access to review terms and techniques at your own leisure. Not only that, but this course puts capability analysis into terms and concepts that are easy to understand and make sense to those who aren't big fans of statistics.
How long would it take you to develop your own course? Hours? Weeks? Unless you can develop a similar course in less than an hour, this course will pay for itself at least ten times over!
The course is yours to keep. Feel free to edit, change or modify however you want, or don't change a thing and teach directly from our material.
Don't spend thousands of dollars hiring a consultant to come in and speak in general terms. Use your knowledge of your company's major problems to elaborate on the material we have put together.
Unless you can show how these concepts relate to actual issues that your employees deal with, you will have a hard time making much of an improvement in the way problems are resolved.
This course has been utilized many times in various industries, and is exactly what you would create on your own, if only you had the time. We have done all the hard work for you, so just follow these
simple steps...
- Download the Powerpoint course
- Edit the master slide with your company logo
- Skim the speaker notes, maybe add a few of your own company specific examples
- Start training your company!
The course is divided into four major sections:
Variation
- What is variation, how to calculate average and standard deviation.
Cp and Cpk
What are they? What do they mean? How do I calculate them? How can I convert them into probability of failure rates?
Normal Distribution
Properties of the normal distribution, including area under the curve estimations using the standard normal tables.
Examples
A real life example utilizing the number of calories eaten per day. Everyone can relate to the example, and it makes understanding the concepts much easier.
There is variation in everything…
- No two processes, individuals, machines, products, are exactly the same
- Variation can be measured, if measurement unit is small enough
- Individual values can not be predicted
- However, group of values create a predictable pattern
[caption id="attachment_17439" align="alignnone" width="1250"]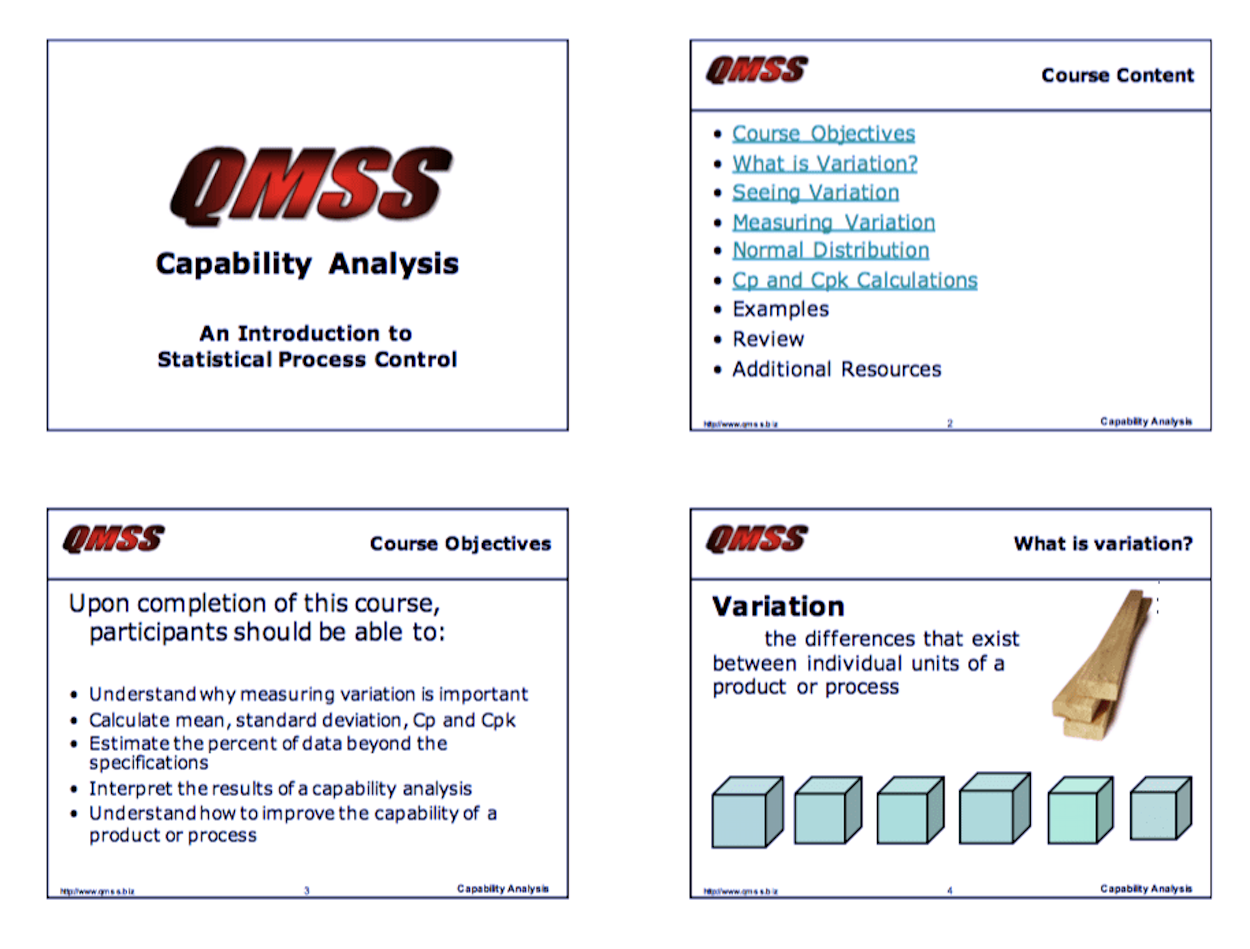 Sample image for training slides[/caption]
Open Source Six Sigma
More products from iSixSigma