
The precision of a measurement system is commonly assessed using a gage repeatability and reproducibility (GR&R) study. In Part 1, this article describes available GR&R metrics. Part 2 covers their applicability to two broad cases of comparative study.
Measurement system analysis has been a major part of process characterizations and improvements, with key guidance from the original Automotive Industry Action Group reference manual. There has been some critical review, particularly of summary metrics such as gage repeatability and reproducibility (GR&R) and percent tolerance (also known as precision-to-tolerance ratio) and what are considered acceptable values.1,2,3 In industries such as medical devices, measurement system analyses can influence decisions that can critically affect the lives of patients. Consequently, the impact of measurement system analyses on decision making, as related to the probability of misclassification, is of vital importance.
This article contains a description of available GR&R metrics, and their applicability to two broad cases of comparative study: 1) comparing one population to another and 2) comparing individual values about a specification. These cases represent the most common applications of measurement systems. Examples of these two applications include comparing two groups based on a change from one group to the next and comparing individual values to a specification for the case of making accept or reject decisions.
Assessment of Measurement Precision
Precision describes the relative spread in measured values for a common item. The precision of a measurement system is commonly assessed using a GR&R. GR&R studies quantify gage variance, and this variance can be compared to a targeted measurement range. The range may encompass the variability observed over the GR&R study, the variability of a separate population or a specification interval. In each case, a gage is generally considered precise enough when gage variation is small compared to the measurement range of interest.
A GR&R study is a designed experiment in which factors influencing gage variance are studied using a full factorial design.4,1 GR&R studies typically include two factors: 1) a random factor representing parts and 2) a factor influencing measurement variation (operator is commonly chosen as the second factor). Additional factors may be added, where each factor may represent additional sources of variation. These additional factors may include measurement instruments, environment, etc. A GR&R study can identify contributions to gage variance in terms of repeatability and reproducibility based on the factorial structure of the controlled experiment. Repeatability describes the contribution to gage variance from a measurement system when the same part is measured multiple times with all other factors held constant. Reproducibility describes the relative contribution to gage variance from additional factors and interactions between additional factors and parts.
Gage error can be estimated using random-effects analysis of variance (ANOVA) methods provided certain assumptions can be met:
- Gage error and measured values are independent.
- The values chosen for measurement in a gage study were drawn from large populations.
- The underlying populations are normal.
- The GR&R study is balanced with sufficient power based on the number of factors.
The total measurement variance σm2 can be defined as
![]()
In equation (1) σp2 and σg2 represent variance from the measured population, and variance from the measurement system respectively. Gage error can be defined by contributions from repeatability and reproducibility error as follows:
![]()
In equation (2), σrepeat2 and σreproduce2 respectively represent variance from repeatability and reproducibility. Reproducibility variance can be further broken down based on contribution from each contributing factor (e.g., operators) and interactions between factors (e.g., operators and parts). Measurement standard deviation σm is the square root of gage variance.
GR&R Metrics Associated with Gage Precision
Gage performance is commonly defined by comparing the relative percentage that gage error consumes over a measurement range. Three different percentages can be readily calculated using gage standard deviation (σg) obtained from ANOVA analysis of a GR&R study:
- Percent study variation
- Percent process
- Percent tolerance
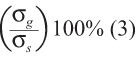
Percent study variation =
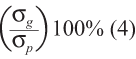
Percent process =
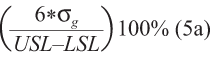
Percent tolerance 2-sided specification =
Percent tolerance 1-sided upper specification =
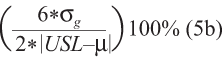
Percent tolerance 1-sided lower specification =
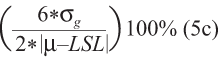
In equation (3), σs is the observed standard deviation of combined measurements taken during a GR&R study. In equations (5a), (5b) and (5c), 6σg in the numerator can be substituted with 5.15σg depending on the desired proportion of the distribution in the comparison range. Under the assumption of normality, a value of 5.15 in the numerator implies 99 percent of the measurement range, while 6 implies 99.73 percent of the measurement range.
In all of the above equations, a lower percentage implies a gage error is smaller compared with the comparison range; therefore, the gage is better able to distinguish between measured values over the same range. The percentage type chosen to define measurement system acceptance depends on the intended purpose of the gage. Each percentage implies different information regarding gage suitability for a specific use.
In all of the above equations, a lower percentage implies a gage error is smaller compared with the comparison range; therefore, the gage is better able to distinguish between measured values over the same range. The percentage type chosen to define measurement system acceptance depends on the intended purpose of the gage. Each percentage implies different information regarding gage suitability for a specific use.
Percent R&R provides insight as to measurement system capability to distinguish parts from one another over the range of measured variation observed during the gage study. The denominator in (3) depends on the range of measured values used in the particular GR&R study. Using the same measurement system, a larger measured range of parts will result in a larger total study variance and lower percent study variation. Given the need to determine gage suitability to compare parts over a range in subsequent studies – and given that parts chosen in the gage study represent populations to be measured in the future – percent study variation may be used to base gage acceptance.
Percent process provides insight as to measurement system capability to distinguish parts over a historic process operating range, where process operating range is typically defined as 5.15 or 6 process standard deviations. If the parts chosen for the gage study are representative of historic process variation then percent study variation will be approximately the same as percent process. In many cases, however, the parts chosen for GR&R study include a narrower or broader range rather than the projected or observed process operating range. In these cases, percent process will be larger or smaller than percent study variation. Percent tolerance provides insight as to measurement system capability to distinguish parts from one another over a range of part acceptance defined by specification limits. In the case of a 1-sided specification, the range is defined by twice the distance between population mean and specification limit. Equations (5a), (5b) and (5c) show that as the specification tolerance narrows (or the distance between the population mean and specification limit narrows), the same gage will consume more of the measurement range of interest, and percent tolerance will increase. The intended purpose of many measurement applications is to compare values to an acceptance range. Percent tolerance is chosen as a common metric to accept a gage as suitable for most measurement applications.
Criteria for acceptable percentages for equations (3) through (5) vary depending on application. Multiple sources list a gage as acceptable when the percentage is less than 10 percent (i.e., the gage precision error is an order of magnitude smaller than the measurement range of interest) and unacceptable when it is greater than 30 percent.2,5,6,7 In the case where the percent is between 10 percent and 30 percent, acceptance may be conditional on other influencing factors – such as cost or risk associated with measurement error, including the risk of measurement misclassification error.
In each of these cases gage precision is established by comparing gage variation to a measurement range of interest. When the gage precision error is small compared to the measurement range of interest, the gage is well suited to differentiate or compare measured values within the range. (The cases described above have not expressly defined gage suitability for differentiating measured values about a specification.)
Probability of Misclassifying Measured Values
To establish gage suitability to effectively measure a value for the purpose of comparing this value with a specification limit, consider a zone on each side of the specification defined by 2.33σg. Units more than 2.33σg away from either side of the specification have no less than a 99 percent chance of being properly classified about the specification value. Using normal distribution assumptions and equation (5), a GR&R percent tolerance value less than 25 percent can ensure that values more than 10 percent outside of the specification tolerance are rejected more than 99 percent of the time. It follows that a smaller gage R&R percent tolerance will increase the confidence in appropriately classifying values more than 10 percent of the specification tolerance away from a specification.8 This further reinforces the usefulness of percent tolerance as universal measurement system acceptance criteria. Low percent tolerance, however, does not eliminate all uncertainty regarding the possibility of gage misclassification error.
Values that fall within 2.33σg of a specification have a higher chance that gage error will misclassify the measured value to the incorrect side of the specification. There are two possible results for misclassification when considering a specification limit:
- Values that are outside of the specification limit are misclassified as being within the specification range, resulting in false acceptance and risk of non-conformance. From here on, this is referred to as the “probability of misclassifying bad as good.”
- Values that are inside of the specification limit are misclassified as being outside of the specification range, resulting in false rejection and excess scrap. From here on, this is referred to as the “probability of misclassifying good as bad.”
Figure 1 shows misclassification types due to gage error for measured values adjacent to a specification limit assuming zero measurement bias.
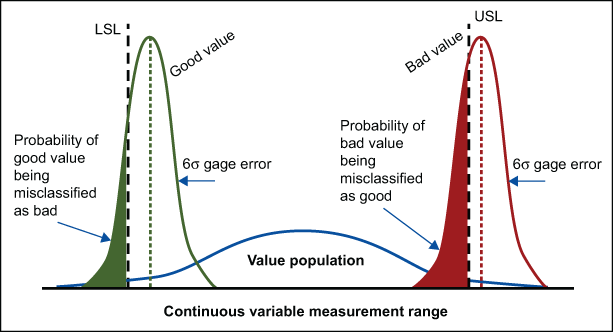
These types of misclassification are expressed as conditional probabilities, in that the estimated value of the part is assumed to be fixed. Given that real manufacturing scenarios involve an entire distribution of part values, gage adequacy is more completely evaluated through the joint distribution of part values and gage error.
The probability of misclassifying a bad part as “good” can be approximated by counting the occurrence that an estimated value outside of the specification tolerance measured inside the specification limits. The probability of misclassifying a good part as “bad” can be found in similar fashion, where the count about the specification limit is switched. To obtain reasonable approximation of small probabilities, the number of random draws in the simulation must be of sufficient size.
The probability of misclassification will increase if 1) the probability that a measured value resides near a specification value increases, 2) the gage error increases or 3) both increase. Comparing the results of probability of misclassification, which are based on both part population and gage error taken with respect to specification values, to percent tolerance, which is only dependent on gage error, it follows that percent tolerance provides partial information for ensuring that measured values are classified correctly.
In addition, the probability of misclassification increases as the part population encroaches on a specification value. As percent tolerance is independent of part population, it is possible to achieve low values of percent tolerance (less than 10 percent), while the probability of misclassification and associated rates of misclassification may be unacceptably large. Using percent tolerance as a single metric for measurement system capability provides limited information in the case of sorting values that reside close to a specification. This suggests that probability of misclassification values can be used to supplement percent tolerance metrics to ensure measurement systems are applied appropriately in sorting applications. It is important to note that probability of misclassification alone does not provide any insight into gage precision. Comparison of percent tolerance with probability of misclassification suggests that both metrics should be leveraged to establish gage capability in the case where a gage is used to sort values about a specification.
Guard Banding Specifications Influence Probabilities of Misclassification
When there is a need to reduce the risk of misclassifying bad values as good, the specification range used to make accept-reject decisions can be narrowed – forcing the misclassification of bad as good to occur less frequently within the narrowed specification range. This concept is commonly referred to as guard banding, and is shown in Figure 2.
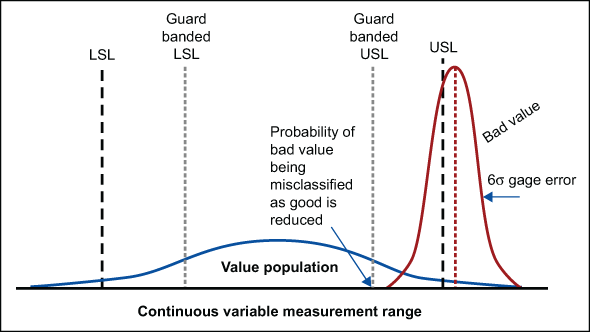
For guard banding to effectively reduce the probability of misclassifying bad as good, the specification amount to be pulled into the specification range must be a function of gage variance. As gage variance increases, the guard banded region must be sufficiently within the allowable specification range to encompass gage error. Thus, the guard banded region will include the measurement range where misclassification is most likely to occur adjacent to the specification value. Guard banding can be quantified as a relative count of gage standard deviation by which specification tolerance is reduced within the allowable specification tolerance. For the purposes of this article, guard banding is the count of gage standard deviations with respect to a single specification. For example, guard banding 2σg within each side of a 2-sided spec would reduce the specification tolerance by 4σg.
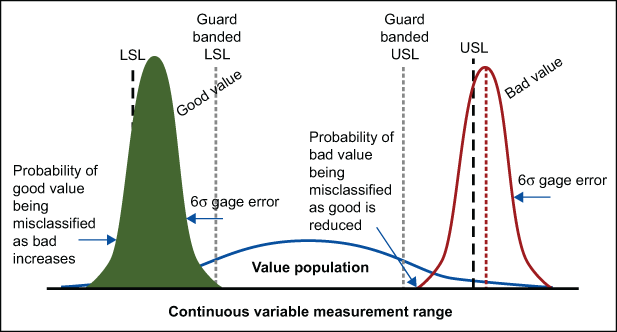
Although guard banding decreases the probability of misclassifying bad values as good, it also increases the probability of misclassifying good values as bad. As the specification range is narrowed, any values that fall between the guard-banded specification and the nominal specification will have a higher probability of being misclassified as bad. Guard banding introduces a tradeoff between reducing risk of false acceptance and increasing scrap rate. This tradeoff is shown in Figure 3.
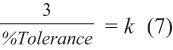
A limit to the tradeoff encountered with guard banding can be reached if gage error is 1) sufficiently large with respect to specification range, and 2) the guard band count of gage standard deviations taken within the specification tolerance consumes the entire specification range. The point at which guard banding will consume the entire specification range can be obtained by substituting equation (6) into the denominator of (5a), and solving for k where k is equal to the number of gage standard deviations taken in from each specification limit. The result is provided in equation (7).
![]()
The effect of guard banding on probabilities of misclassification can be estimated except in the following circumstance: The specification used to classify observations from the measured distribution as good or bad is the original specification value and the specification used to establish classification as accepted or rejected is the guard banded value.
References
1. Montgomery, D. C., and G. C. Runger. “Gage Capability and Designed Experiments. Part I: Basic Methods.” Quality Engineering 6 (1993a): 115-135.
2. Automotive Industry Action Group. Measurement System Analysis: Reference Manual, 3rd Edition. Southfield, MI: American Society for Quality Control, 2003.
3. Wheeler, Donald J. “An Honest Gage R&R Study.” SPC Inc, 2008.
4. Montgomery, D. C., and G. C. Runger. “Gage Capability and Designed Experiments Part II: Experimental Design MEthods and Variance Component Estimation.” Quality Engineering 6 (1993b): 289-305.
5. Engel, J., and B. De Vries. “Evaluating a well-known criterion for measurement precision.” Journal of Quality Technology 29 (1997): 469-476.
6. Majeske, Karl D., and Chris Gearhart. “Approving Measurement Systems when Using Derived Values.” Quality Engineering 18 (2006): 523-532.
7. Erdmann, Tashi P, Ronald J.M.M. Does, and Soren Bisgaard. “Quality Quandaries: A Gage R&R Study in a Hospital.” Quality Engineering 22 (2010): 46-53.
8. Taylor, Wayne. “Generic SOP – Statistical Methods for Measurement System Variation, Appendix B Gage R&R Study.” Wayne Taylor Engerprises, Inc., n.d.