Category: Sampling/Data

Big Data vs. Small Data: Which Is Right for Your Business?
Published:Big data vs. small data, which one are you choosing for your business? Data is a big market right now, something that it has held the distinction of for the last decade or more. Data drives business decisions, calls forecasts for future trends, and so much more. As such, it helps to have a plan […]
Read more »
How to Build a Data-Driven Culture in Your Organization
Published:Is it easy to build a data-driven culture for your business? Data is a driving force in any modern organization. Even mom-and-pop stores are leaning on what they can glean from the digital revolution. As such, it is more important than ever to take the steps to create a data-driven culture to take your organization […]
Read more »
The Most Popular Tools For Data-Driven Decisions In Business
Published:What tools are businesses using for data-driven decisions? There is plenty to be said about the proliferation of data in the workplace. However, one thing is clear: it is here for the long haul. As such, learning how to manipulate this data for your organization’s well-being is simply part and parcel of the […]
Read more »
Random Sampling: Key to Reducing Bias and Increasing Accuracy
Published:Random sampling is a statistical method of selecting a sample of data from a larger set in such a way that each data point has an equal chance of being selected so that the sample represents the population from which it was drawn. What Is Random Sampling? Random sampling is a method of […]
Read more »
Rounding and Round-off Rules: How It Fits Into Your Data Analysis
Published:When performing statistical data analyses, quality professionals are always challenged to maintain data integrity. When should you round up the answer; when should you round down? How many significant figures are appropriate for the data set that has been taken? Below is a set of simple rules that should help you traverse the […]
Read more »
Margin of Error and Confidence Levels: Make the Most of Your Customer Surveys
Published:Do you know how to account for the margin of error in your customer surveys? A survey is a valuable assessment tool in which a sample and information relate to a larger population. Surveying is like tasting a soup, a few spoonfuls tell what the whole pot tastes like. An Example of Margin […]
Read more »
Use a Classification and Regression Tree (CART) for Quick Data Insights
Updated:In the Analyze phase of a DMAIC (Define, Measure, Analyze, Improve, Control) Six Sigma project, potential root causes of variations and defects are identified and validated. Various data analysis tools are used for exploratory and confirmatory studies. Descriptive and graphical techniques help with understanding the nature of data and visualizing potential relationships. Statistical analysis techniques, […]
Read more »
A Study of Estimates of Sigma in Small Sample Sizes
Updated:This paper looks at some of the methods of estimating standard deviation (which I will usually refer to as ‘sigma’). Additionally, I propose a new formula for estimating sigma for small sample sizes and also present a means to mathematically evaluate these competing estimates of sigma. The question was posed to me: “I have five […]
Read more »
Sampling
Updated:It is often not possible or practical to collect all the data from your process. It can be too costly or take too much time. It may not be possible to access all the data. If this situation exists in your process, then you will need to sample your data. Overview: What is sampling? There […]
Read more »
The Importance of Sample Size
Published:What do Goldilocks and statistical analysis sample size have in common? A razor-sharp focus on “just right.” A sample size that is too big or too small leads to inaccurate data and wasted resources (although hopefully not three bears).
Read more »
Improving Accuracy with Sampling: Techniques and Strategies
Updated:When doing statistical analysis, it is impractical and often impossible to gather all the available data. That is when you would seek to sample the data to analyze it and make decisions about your process. In statistics, a sample refers to a group of individuals, objects, or events that are selected from a larger population […]
Read more »Using Censored Data in Transactional Processes
Updated:Censored data is commonly used in reliability studies to determine the mean time to failure in order to establish warranty and maintenance periods for products. A large number of samples are subjected to either normal-use or accelerated-use conditions. Failure modes and occurrences are logged. Plotting the distribution of the sample failures over time allows the […]
Read more »TaaG Analysis – Fast and Easy for Comparing Trends in Large Data Sets
Published:TaaG (trends at a glance) analysis is a fast way to compare trends of subsets of data across large data sets. It is an ideal tool to use in the Measure and Control phases of DMAIC (Define, Measure, Analyze, Improve, Control) projects. The value of TaaG analysis is best understood by way of example. Suppose […]
Read more »How to Avoid The Evils Within Customer Satisfaction Surveys
Published:When the Ritz-Carlton Hotel Company won the Malcolm Baldrige National Quality Award for the second time in 1999, companies across many industries began trying to achieve the same level of outstanding customer satisfaction. This was a good thing, of course, as CEOs and executives began incorporating customer satisfaction into their company goals while also communicating […]
Read more »VOC: Comparing Reactive Data and Proactive Data
Published:Collecting data – be it voice of the customer or otherwise – requires a plan. Details of the plan should include what data to collect, how to get the information, where the information will come from and so on. Before any of these details are defined, however, the first step is to identify what a […]
Read more »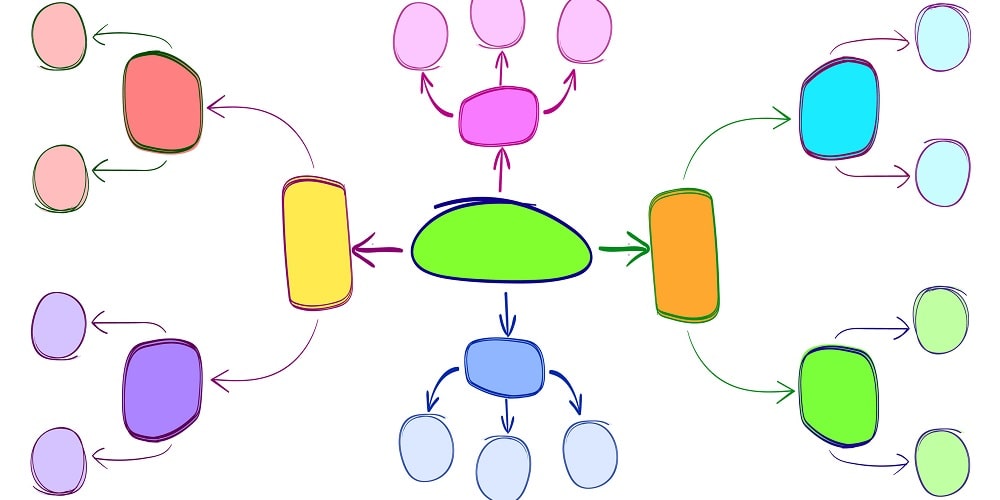
Mind Mapping: A Simpler Way to Capture Information
Published:Reducing wait times is a perennial challenge for the service industry, particularly if you haven’t rooted out all the causes for the delays. The mind mapping visualization tool can help you make sense of large volumes of interconnected data and fast-track implementation of Lean Six Sigma.
Read more »Process Data Mining: Partitioning Variance
Published:Manufacturing facilities can be faced with major challenges when it comes to process improvement, largely because practitioners don’t always know enough about the underlying process factors (x’s) are that drive the improvement metric (Y). Practitioners might have a brainstorming session to tap into the collective experience of experts involved in the process, and design experiments […]
Read more »Reducing Sampling Costs: Implementing a Variable Sampling Interval Strategy
Published:Most manufacturing processes are controlled by sampling a product at some regular interval. Often, when a process is running normally, this interval is once every shift. It is not too surprising that in today’s economic climate, where cutting cost is of paramount importance, reducing sampling to save money is inviting, especially at large manufacturing facilities, […]
Read more »Is There Bias In Your Random Sample?
Published:By definition, a sample of size n is random if the probability of selecting the sample is the same as the probability of selecting every other sample of size n. If the sample is not random, a bias in introduced which causes a statistical sampling or testing error by systematically favoring some outcomes over others. […]
Read more »
GE’s Six Sigma Focus On Span
Updated:We have heard about GE being one of the biggest proponents of Six Sigma, both for their own processes and for their customers. We’ve also heard how much GE has saved by implementing Six Sigma. This article is not a regurgitation of the existing rhetoric. Instead, I’d like to focus on an aspect of how […]
Read more »Actionable Information from Soft Data
Published:Engineers, Six Sigma practitioners and other researchers often work with “hard” data – discrete data that can be counted and legitimately expressed as ratios. But what of “soft” data, things like opinions, attitudes and satisfaction? Can statistical process controls (SPC) be applied here? Can process variation in customer satisfaction, for example, be measured and then reported to […]
Read more »How To Turn Process Data Into Information
Published:A repeated series of actions and variables is a process. A collection of processes is a system. Virtually perfect Six Sigma quality results from an optimal interaction of all the variables in a given system. Process and system questions we all face at work include: Which variables are the most important to the customer? Am […]
Read more »Digging for Data: Insurance Companies Strive to Improve
Published:Based on experience with property and casualty insurers (P&C), one of the biggest profitability drivers is the expense incurred staffing and settling claims. Many P&C insurers struggle with timely and efficient claims processing. In working with P&C companies consulting groups found three common challenges that project teams must address to improve the overall claims settlement […]
Read more »Building a Sound Data Collection Plan
Published:Black Belts and Six Sigma practitioners who are leading DMAIC (Define, Measure, Analyze, Improve, Control) projects should develop a sound data collection plan in order to gather data in the measurement phase. There are several crucial steps that need to be addressed to ensure that the data collection process and measurement systems are stable and […]
Read more »