Category: Cause & Effect
The Cause-and-Effect (a.k.a. Fishbone) Diagram
Updated:When utilizing a team approach to problem-solving, there are often many opinions as to the problem’s root cause. One way to capture these different ideas and stimulate the team’s brainstorming on root causes is the cause and effect diagram, commonly called a fishbone. The fishbone will help to visually display the many potential causes for […]
Read more »
Fishbone Diagrams: A Powerful Tool for Root Cause Analysis
Updated:Fishbone diagrams are used to drill down to the root cause of a problem. The diagram looks like the bones of a fish, where each main bone represents a possible category of root cause, and subsequent drilling down is shown as smaller and smaller bones.
Read more »
Root Cause Analysis: Integrating Ishikawa Diagrams and the 5 Whys
Updated:Root cause analysis (RCA) is a way of identifying the underlying source of a process or product failure. As such, then the right solution can be identified. RCA can progress more quickly and effectively by pairing an Ishikawa diagram. You can also use the scientific method in the form of the well-known plan-do-check-act (PDCA) cycle […]
Read more »
How Lean Six Sigma Tools and an Acceleration Technique Reduced Baggage Connection Delays by 65%
Updated:In 2016, Kenya Airways embarked on a project to increase its baggage handling efficiency. The way that it applied tools from both Lean and Six Sigma methodologies showcases how adaptable these concepts can be and that they are applicable well beyond the industries that they are most commonly associated with. Kenya Airways was able to […]
Read more »
How Six Sigma and Lean Tools Helped Recover Nearly 4 Million Dollars in Annual Revenue
Updated:When faced with the news that drug manufacturers of cancer medication were responsible for causing a massive amount of financial waste, the oncology department at UCSD utilized Six Sigma and Lean tools like a cause-and-effect diagram, a Kaizen Event, the 5 Whys, and others in order to improve scanning processes that could help in recovering […]
Read more »
How Six Sigma Tools Sharply Decreased Downtime At The Nature Conservancy’s Headquarters
Updated:The web development team at The Nature Conservancy in Arlington, VA, was able to utilize Lean and Six Sigma tools to close the gap in downtime due to a coding freeze every 45 days. The Nature Conservancy used such Six Sigma tools as process maps, The 5 Whys, and cause-and-effect diagrams to dramatically bring the […]
Read more »
The 2.67 Million Dollar Mystery (And How 5 LSS Tactics Solved It)
Published:This major beverage manufacturer was spending millions of dollars per year to replace recyclable plastic shells to transport 2-liter bottles from the plant to their customers. Where did all the plastic shells go? Let’s find out. The process of retrieving delivered plastic shells from the customer should have been easy, but apparently it wasn’t. The […]
Read more »
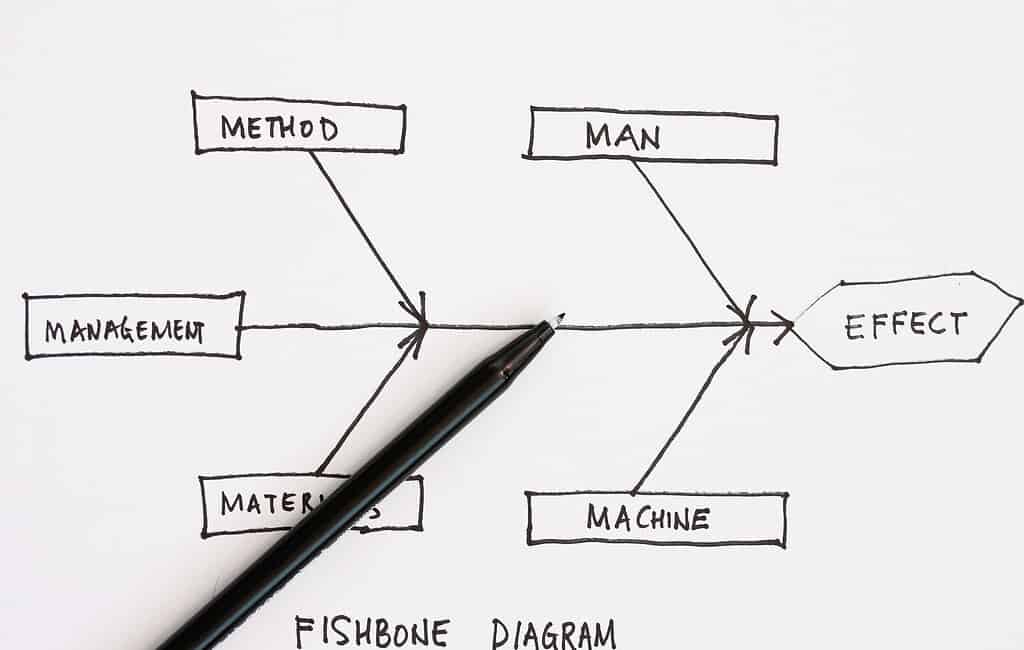
The Fundamentals of Cause-and-effect (aka Fishbone) Diagrams
Published:A popular means for identifying the causes of a particular problem, or effect, is the aptly named cause-and-effect diagram. As the completed graphic resembles the bones of a fish, it is also commonly referred to as a “fishbone” diagram (Figure 1). The head of the “fish” is the problem statement, such as “late delivery of […]
Read more »
Harvesting Value in Transactional Processes with Lean Six Sigma
Published:While transactional processes might require a different approach, the Lean Six Sigma tools you use are the same. Follow this sequence of five tools to begin fixing your invisible problems before they reach your customers.
Read more »Screening Tools Can Speed Up Six Sigma Projects
Published:Lean Six Sigma has led to improvements for many of the companies that use it; a few companies have even achieved spectacular results. However, not every company is pleased with its progress with Six Sigma. One area that may lead to this disparity of results is the use of screening tools developed by Dorian Shainin. […]
Read more »Using Six Sigma to Reduce Pressure Ulcers at a Hospital
Published:Since 2001, Thibodaux Regional Medical Center (TRMC) in Louisiana has applied Six Sigma and change management methods to a range of clinical and operational issues. One project that clearly aligned with the hospital’s strategic plan was an initiative to reduce nosocomial or hospital-acquired pressure ulcers, because this is one of the key performance metrics indicating […]
Read more »5 Lean Tools and Principles to Integrate into Six Sigma
Published:Increasingly, organizations that use Six Sigma are making an effort to integrate Lean into their existing process-improvement framework. For many, combining Six Sigma’s focus on process quality and Lean’s emphasis on turn-around time results in more high-impact, quick-hit projects. To gain this advantage, however, organizations must face a difficult obstacle: integrating Lean without creating ripples […]
Read more »Cause-and-effect Diagrams and Lean for Service Processes
Published:Lean improvement of service processes is somewhat different from Lean improvement of manufacturing processes. Efficiency is usually a measure of speed and cost and Lean improvement in efficiency is achieved by eliminating waste in time or resources. Effectiveness is usually a measure of quality and the overall objectives of the enterprise in that regard. If […]
Read more »
Final Solution Via Root Cause Analysis (with a Template)
Updated:“Every defect is a treasure, if the company can uncover its causeand work to prevent it across the corporation.”– Kilchiro Toyoda, founder of Toyota When people discover problems, the most frequent response is to rush to find a solution. Finding an immediate fix for the problem is very satisfying, no matter how many times this […]
Read more »Decision-Making with Cause-and-Effect Analysis and DOE
Published:Business process improvements, the grail of any company’s operations, translate directly into better profits by cutting costs and increasing competitiveness at the same time. In many cases, business process improvements have accelerating cumulative effects on company profits. If an insurance company, for example, can underwrite policies faster or settle claims faster, it is providing better […]
Read more »Categories of Legitimate Reservation Focuses Fishbone
Published:The fishbone diagram is the most commonly used cause-and-effect analysis tool in Six Sigma. Cause-and-effect analysis is one of the key tasks in any Six Sigma DMAIC project because half of the game is won when the correct root causes of the problem (the Y) are found. However, poor use of the fishbone diagram is […]
Read more »Communication and Business Case Key to Revising Process
Published:Through a two-year Six Sigma project, the Department of Defense (DoD) Acquisition and Technology Programs Task Force (ATP TF) coordinated a revision to a joint weapon system safety review process that provided a 59 percent reduction in cycle time. Without the Six Sigma framework, the project might not have achieved the success it did within […]
Read more »Applying Systems Thinking to the Practice of Six Sigma
Published:Well-focused improvements done in the right place can lead to significant system-wide results for an organization. In simple terms, it is a matter of choosing the right Six Sigma projects. But the problem is that it is not always easy to know which projects will produce the highest system-level leverage. Often Green Belts and Black […]
Read more »Tree Diagrams for Six Sigma: Plain and Simple?
Published:With the complexity of many of the tools in the Six Sigma kit, it is easy to look at tree diagrams as fairly simple and routine. Experience shows, though, that there are enough pitfalls encountered and benefits missed that it is worth consolidating a few time-won guidelines and tips about applying them and explanations on […]
Read more »Causal Loop Diagrams: An Orientation in Software Context
Published:Among the tried and true tools in the Six Sigma kit, cause-and-effect diagrams in the simple form of a tree, a fishbone or a Y-to-x diagram are a big help in identifying factors (x’s) that may drive changes in a results variable of interest (Y). There are times, though, that a flat, two-dimensional hierarchy does […]
Read more »Combining SIPOC with the Cause-and-Effect Diagram
Updated:Six Sigma practitioners strive to find the root causes of defects quickly and accurately. One of the tools that provides a good initial view of the process Six Sigma is being used to optimize is SIPOC (supplier, input, process, output, customer). This tool is especially helpful when the improvement project is aimed at a process […]
Read more »
Using Data Analysis to Identify Six Sigma Sales Projects
Published:When you think of Six Sigma, you likely think of manufacturing. But apply the operational excellence methodology to your sales and marketing departments, and an untapped avenue of improvement projects opens up that can increase sales.
Read more »A Six Sigma Case Study – Tutorial for IT Call Center – Part 3 of 6
Published:This combination “case study and tutorial” tracks the inception of a Six Sigma DMAIC project by an IT support business. The project is aimed at helping the company become more competitive and profitable. Each part follows the project team as it works through another stage of the DMAIC methodology. Click to read the rest of […]
Read more »A Six Sigma Case Study – Tutorial for IT Call Center – Part 4 of 6
Published:This combination “case study and tutorial” tracks the inception of a Six Sigma DMAIC project by an IT support business. The project is aimed at helping the company become more competitive and profitable. Each part follows the project team as it works through another stage of the DMAIC methodology. Click to read the rest of […]
Read more »