Tag: Fishbone
The Cause-and-Effect (a.k.a. Fishbone) Diagram
Updated:When utilizing a team approach to problem-solving, there are often many opinions as to the problem’s root cause. One way to capture these different ideas and stimulate the team’s brainstorming on root causes is the cause and effect diagram, commonly called a fishbone. The fishbone will help to visually display the many potential causes for […]
Read more »
The Fundamentals of Cause-and-effect (aka Fishbone) Diagrams
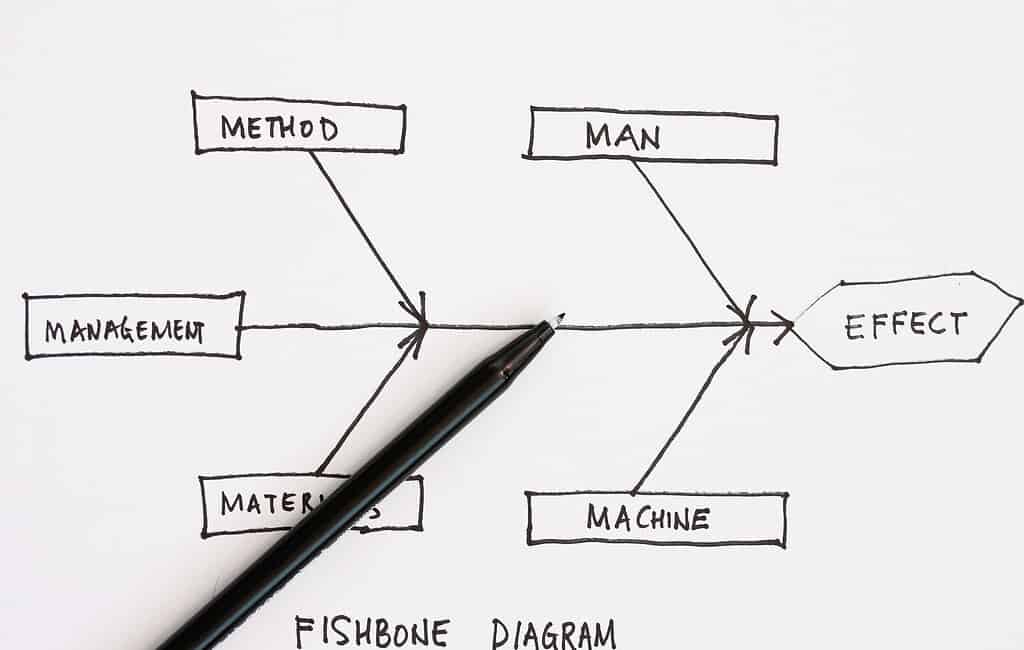
Published:A popular means for identifying the causes of a particular problem, or effect, is the aptly named cause-and-effect diagram. As the completed graphic resembles the bones of a fish, it is also commonly referred to as a “fishbone” diagram (Figure 1). The head of the “fish” is the problem statement, such as “late delivery of […]
Read more »Categories of Legitimate Reservation Focuses Fishbone
Published:The fishbone diagram is the most commonly used cause-and-effect analysis tool in Six Sigma. Cause-and-effect analysis is one of the key tasks in any Six Sigma DMAIC project because half of the game is won when the correct root causes of the problem (the Y) are found. However, poor use of the fishbone diagram is […]
Read more »Combining SIPOC with the Cause-and-Effect Diagram
Updated:Six Sigma practitioners strive to find the root causes of defects quickly and accurately. One of the tools that provides a good initial view of the process Six Sigma is being used to optimize is SIPOC (supplier, input, process, output, customer). This tool is especially helpful when the improvement project is aimed at a process […]
Read more »