Category: Control Charts

Common Cause vs. Special Cause Variation: What’s the Difference?
Published:Common cause vs. special cause variation, aren’t they the same thing? At first glance, you’d be allowed to think so. However, as with any part of the production cycle, there is a reason for these two measurements to exist. So, let’s dive right into what makes these variations different, and how to identify and benefit […]
Read more »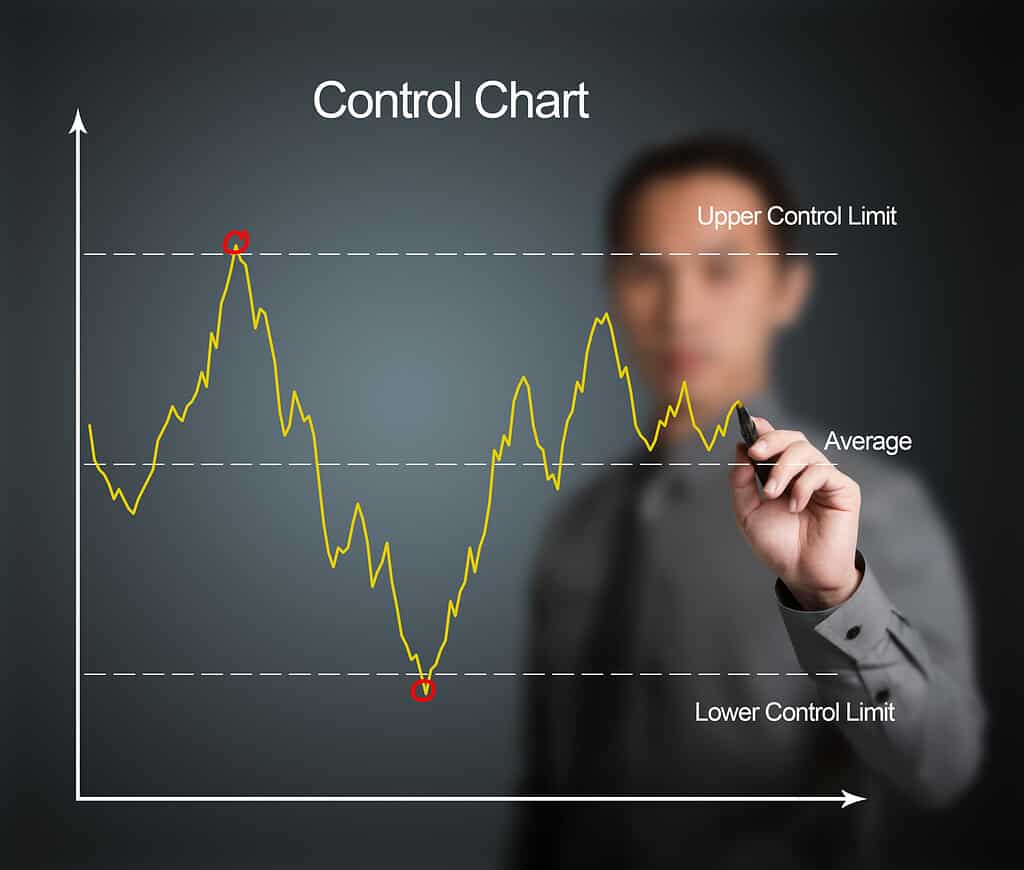
The Complete Guide to Understanding Control Charts: How They Work, and Which to Use
Published:Control charts have two general uses in an improvement project. Undeniably, the most common application is as a tool to monitor process stability and control. A less common, although some might argue more powerful, use of control charts is as an analysis tool. Throughout this guide, you’ll have the various control charts identified. Accordingly, you’ll […]
Read more »
Variable vs. Attribute Data: What’s the Difference?
Updated:Throughout any project, you’re going to gather up quite a bit of data. Now, this can be broken down into two categories: variable and attribute data. Understanding the difference and learning how it is applicable during the analysis stage can be crucial for future decision-making. So, with that in mind, let’s take a deeper dive […]
Read more »
Streamlining Six Sigma Projects with the 7 QC Tools
Published:The seven basic tools in my home tool chest are a hammer, screwdriver, wrench, saw, drill, pliers, and duct tape. What basic QC tools do you have in your continuous improvement tool chest? Let’s check it out.
Read more »
Trend Charts in Quality Management: Enhancing Process Monitoring
Published:You can learn a lot about your process by monitoring its change over time. There are different trend charts which will allow you to do that. Let’s look at a few.
Read more »
The FabChip Caster Challenge: A Lean Six Sigma Journey To $3,000,000
Published:Background FabChip (fictitious name) was a leader in the global semiconductor industry, known for its cutting-edge wafer-fabrication equipment. With the semiconductor sector at the core of everything from smartphones to medical devices, FabChip’s role in supplying this vital technology was crucial. The equipment FabChip manufactured, however, was often large and complex. When it arrived at […]
Read more »
Assessing Process Stability: Techniques and Tools
Published:Have you ever wondered why your doctor may keep you waiting in the waiting room or why you have to fast before doing a blood test? Let’s see if Lean Six Sigma can give you an answer.
Read more »
Steps in Constructing an X-Bar and R-Control Chart
Published:Steps in Constructing an X-Bar and R Control Chart: This document contains the step-by-step instructions to construct an X-bar and R control chart. First the R chart is constructed. If the R chart validates that the process variation is in statistical control, the XBAR chart is constructed.
Read more »
Predicting Success: A Comprehensive Guide to Trend Analysis Tools
Published:Do you possess a crystal ball to see what the future brings for your organization? Probably not, but you do have a statistical version of a crystal ball by using trend analysis.
Read more »
Using Voice of the Process to Identify Critical Processes for Improvement
Published:Are you hearing voices? If it’s in a business context, then there is nothing to worry about — and it might even be a good thing. Let’s listen in to the voice of the process and hear what it has to say.
Read more »
Run Charts: A Simple and Powerful Tool for Process Improvement
Published:The run chart is a powerful, simple, and easy-to-use process improvement tool. Often, the run chart is shortchanged as the statistical tests that can be used with run charts are overlooked. This article takes the reader through the benefits of a run chart as well as how to correctly create and analyze one. […]
Read more »
Steps in Constructing a p-Chart: Finding Nonconformance in Your Data
Published:Steps in Constructing a p-Chart: p Charts can be used when the subgroups are not of equal size. This guide shows you the steps involved in constructing a p Chart.
Read more »
Out of Control Action Plan: Correcting Process Variants for Optimal Performance
Updated:Out-of-control Action Plans (OCAPS) are a piece of the Lean Six Sigma methodology that is often overlooked. Though they have been phased out in some organizations, it is important to understand their purpose and how they can help a company improve its processes.
Read more »
Understanding Exponentially Weighted Moving Average for Time Series Analysis
Updated:Does your data from yesterday represent the current state of your process better than that from a month ago? How can you place more emphasis on it yet still make use of older data? That’s what the Exponentially Weighted Moving Average does.
Read more »
Short-Run Statistical Process Control Techniques
Updated:Short production runs are a necessity in high-mix, low-volume manufacturing environments. The trend in manufacturing has been toward smaller production runs, with production runs – as well as products – tailored to the individual customer’s needs. Although this minimizes inventory and improves responsiveness to the customer, it complicates the application of statistical process control (SPC). Classical […]
Read more »
Control Charts and Employee Engagement Helped This Company Save Over $150,000 in One Year
Updated:Providing the proper organizational environment for engaging people in your continuous improvement effort will provide large benefits for your organization. In this study, we look at how the combination of using control charts and providing an environment for people engagement helped one company achieve significant financial benefits. Control charts are a powerful tool for understanding […]
Read more »
Think Outside the Box Plot
Published:A box plot may seem like a simple tool, but as this example shows it can help reveal common and special cause variation that may not have otherwise been noticed. Be sure you’re looking below the surface to optimize your performance!
Read more »
Quality Control Just Got Easier: Learn How to Use U Charts
Updated:A U chart is one of four quality control charts that engineers use to track variation in a manufacturing process. The other three typical quality control charts are the p chart (which plots the proportion of defective items, the c chart (which shows the number of defects), and the np chart (which shows the number […]
Read more »
Improving Process Efficiency with Statistical Process Control
Updated:Do you want to know whether your process is in control or not? Statistical Process Control, or SPC, is the tool you want to learn about, so let’s get started.
Read more »
Using Subgrouping to Monitor Process Performance
Updated:When you speak of subgrouping, it is usually in the context of constructing a control chart. Let’s explore the topic in a little more detail. Subgrouping is a technique used in control charts to group data into smaller, more manageable sets or subgroups. The purpose of subgrouping is to increase the sensitivity of the control […]
Read more »
Assessing Process Performance: The Value of Establishing Baselines
Updated:How do you know if your diet is working? You need to start with a baseline and then measure change from that. You should do the same for all your processes. From that process baseline, you can know whether your process is getting better, worse, or not changing. The term “process baseline” typically refers to […]
Read more »
Maximizing the Benefits of In-Control: Tips for Process Improvement
Updated:In-control is not referring to the behavior of your children. It’s about whether your process is exhibiting common or special cause variation. Let’s explore how this works.
Read more »
The Impact of Key Business Issues: Understanding and Addressing Critical Challenges
Updated:Are all your organization’s problems and issues of equal importance? Probably not. How should you handle those that are the most critical and important? Let’s find out. A Key Business Issue (KBI) refers to a critical problem or challenge that your organization faces, which can significantly impact your performance, growth, or competitiveness. KBIs are specific […]
Read more »Monitoring Process Stability with Control Charts
Updated:Since there is variation in all processes, how can you tell whether the variation is due to random expected variation, or something unexpected? The control chart is a tool for making that distinction. Let’s learn how that is done.
Read more »