
What is your Exponentially Weighted Moving Average? If you are monitoring your process data over time, you might want to place greater emphasis on your most recent data and less on your historical data. This will be very important if your process is not stable but is increasing or decreasing in value.
Overview: What Is an Exponentially Weighted Moving Average (EWMA)?
The Exponentially Weighted Moving Average (EWMA) is a quantitative technique used as a forecasting model for time series analysis. The concept of using a moving average is designed to give more weight for newer data points and less for older ones. The weights decline exponentially as the data points get older. An exponentially weighted moving average reacts quicker to recent process changes than a simple moving average which applies an equal weight to all data points in a specified period.
The only decision you must make when using an EWMA is the value of the parameter alpha. Alpha, which ranges from 0 to 1, determines how important the current observation is in the calculation of the EWMA. Alpha represents the degree of weighting decrease and is a constant smoothing factor. A higher alpha discounts older data faster thereby placing greater relevance on your more current data.
Below is the formula for the EWMA’s calculation:

Where:
- Alpha = The weight decided by you
- r = Value of the series in the current period
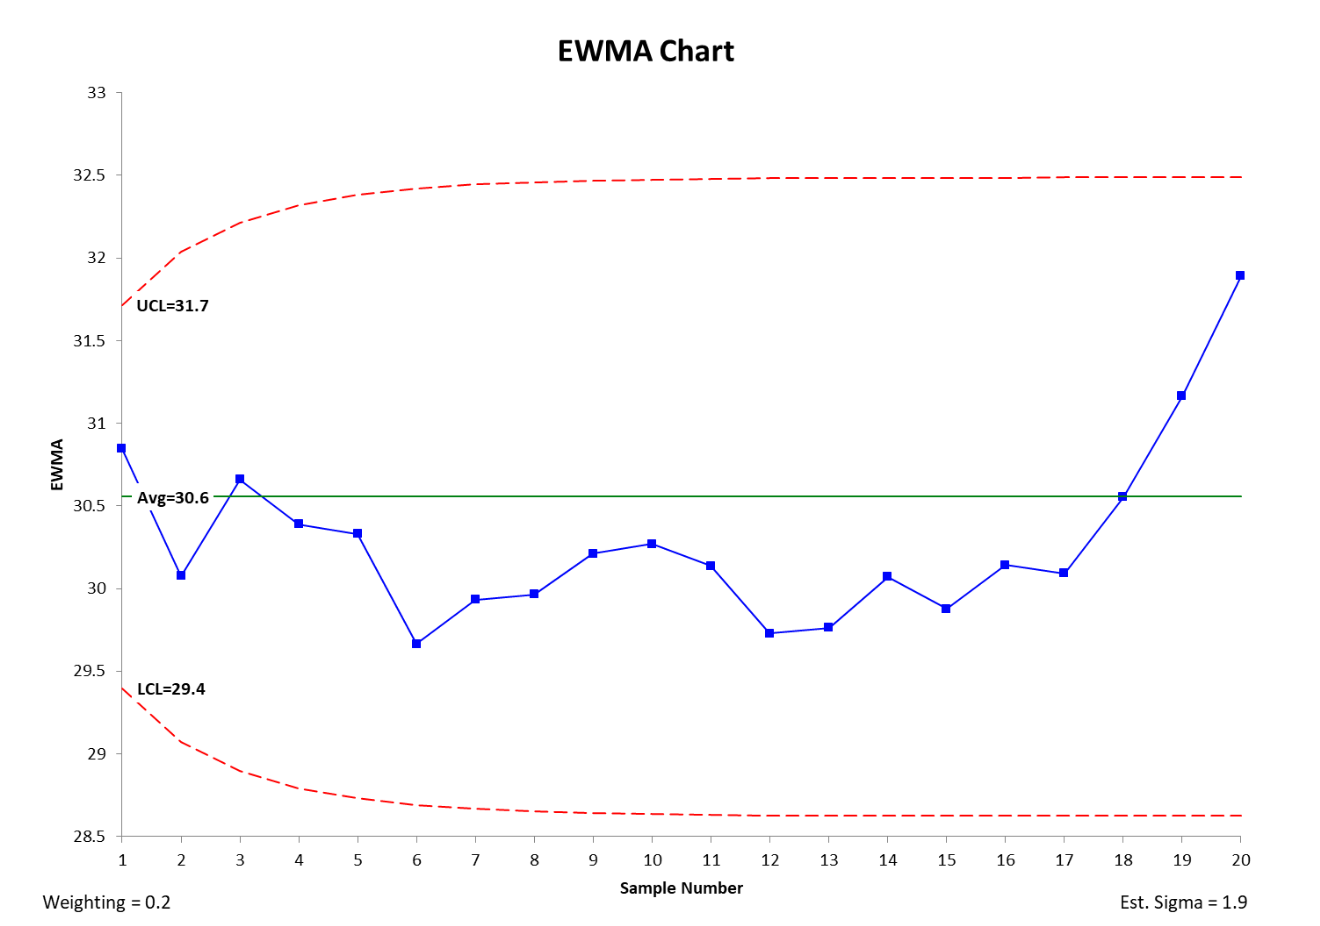
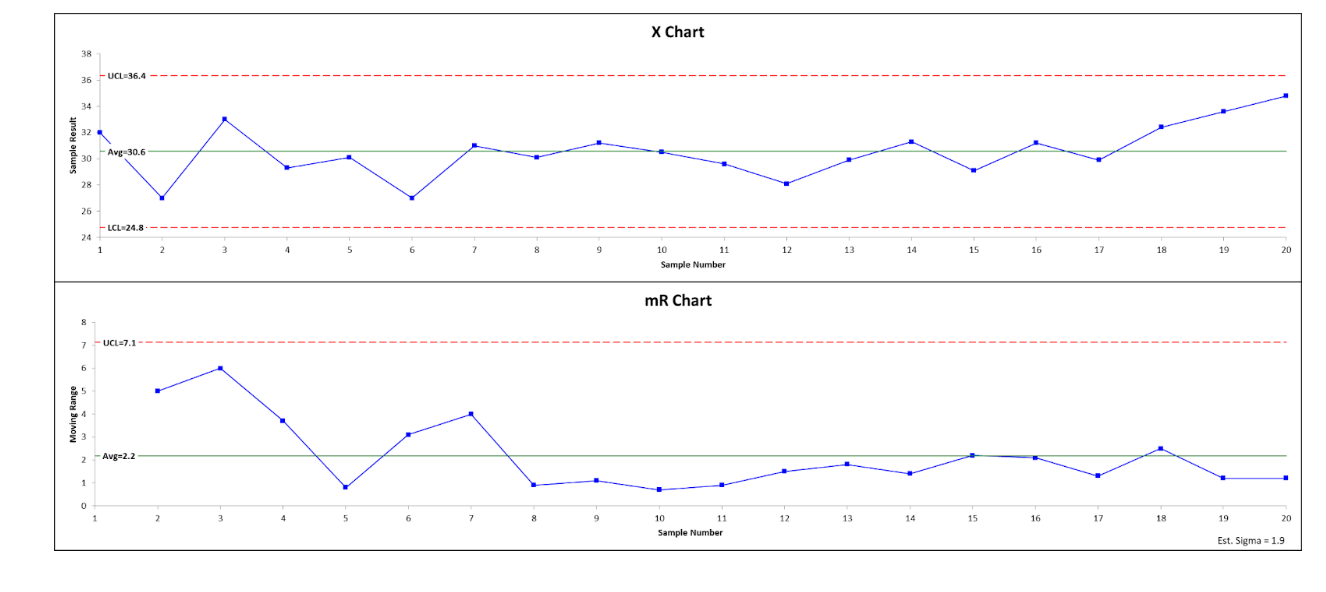
While EWMA is not used as often in forecasting as other more sophisticated techniques, it is frequently used in control charting of process data. The EWMA chart uses the exponentially weighted moving average of all previous sample means. EWMA weights samples in a geometrically decreasing order so the most recent samples are more heavily weighted while prior samples are given less consideration. The EWMA chart is particularly sensitive to small shifts in the process mean but does not do as good a job detecting larger shifts as the traditional Shewhart charts (Xbar/R or Xbar/S).
An Industry Example of EWMA
The company Lean Six Sigma Black Belt was asked to do a control chart for some process data. Since she felt recent process shifts might make current data more relevant, she decided to do an EWMA control chart. For comparison, she also did a standard X/MR chart. Below are her two control charts.
Why It Matters
So, why does this tool see use in any sort of statistical analysis? Data is rarely rigid, it often fluctuates over time. As such, utilizing something like EWMA allows you to see if these are small or large shifts. Larger deviations can indicate a problem, but a smaller shift isn’t such a big deal.
Other Tools and Concepts
We’ve talked about how to calculate the EWMA, but what about the other components of control charts? You might want to look into the differences between common and special cause variations. These measurements are vital if you have constantly evolving processes.
Further, you might want to learn about the differences between variable and attribute data. While at first glance you’d be forgiven for mistaking them, these are two very different forms of data. Understanding when to use it could make your next round of analysis a smoother experience as a whole.
Conclusion
EWMA is a crucial tool when looking at your sales data over time. Understanding how to calculate up-to-date sales info can paint a more accurate picture of how things are faring in the present, rather than accounting for yesterday’s data. Make sure to make good use of EWMA, especially if you’ve got processes that are constantly evolving.