Category: Capability Indices/Process Capability

A Step-by-Step Guide: How to Calculate Your Process Sigma
Published:How do you calculate your Process Sigma? Determining the lowest acceptable defect rate in your production is a way to increase customer trust and continue to follow through on quality. Consider a power company for illustration purposes: A power company measures its performance in uptime of available power to its grid. Here is the five-step process […]
Read more »
Leveraging Process Capability Analysis to Outperform Competitors
Published:Background In a highly competitive market, a plastic parts company leveraged Lean Six Sigma methodologies, particularly Process Capability Analysis (Cpk and Ppk), to analyze supplier performance and strategically improve their product offering. By selecting the most capable supplier and tightening component specifications, the company not only outperformed competitors but also created value for its customers, […]
Read more »
Finding the Sigma Level of Customer Complaints
Published:At the beginning of a deployment, many companies set a goal of 3.4 defects per million opportunities (DPMO) using Six Sigma quality concepts in production and later extend this concept to other operational areas. Fewer companies, however, have extended Six Sigma from a manufacturing application to manage customer satisfaction or customer complaints. However, […]
Read more »
Exploring Process Capability Analysis: A Versatile Tool for Quality Assessment
Published:As the name implies, capability analysis is an analysis of the ability of your process to meet your customer’s expectations and requirements. There are a number of calculated metrics which can be used to help you do your capability analysis.
Read more »
Process Capability (Cp, Cpk) and Process Performance (Pp, Ppk): What’s the Difference?
Published:In the Six Sigma quality methodology, process performance is reported to the organization as a sigma level. The higher the sigma level, the better the process is performing. Another way to report process capability and process performance is through the statistical measurements of Cp, Cpk, Pp, and Ppk. This article will present definitions, […]
Read more »
Calculate Capability Indices with Only One Specification
Updated:How do you calculate capability indices? Capability analysis is an essential tool for statistical process control (SPC) and process improvement, applicable to a variety of environments from hospitals and labs to assembly and manufacturing. How to Calculate Capability Indices The formula for calculating a Cpk index is easily found: USL, upper specification limit; LSL, lower […]
Read more »
Process Capability – Surface Finish Example: Part 2
Updated:In Part 2 we look at failure rates and material conditions for a surface finish example.
Read more »
Process Capability – The Basics: Part 1
Updated:In Part 1, we explore the concept of process capability, including how to calculate it and what to do with non-normal data.
Read more »
Increase Your Process Capability with L2 Spreadsheets
Updated:When it comes to process capability, the more tools you have, the better. An L2 spreadsheet can help to make working with your capabilities a simpler endeavor. L2 Spreadsheet An L2 spreadsheet is just one of many spreadsheets that can help you be more knowledgeable about the ins and outs of your business. Overview: What […]
Read more »
The Douglass Index: A Powerful Tool for Managing Repeatability and Reproducibility Rates
Updated:Having repeatability and reproducibility rates that are 10% or lower is ideal for applying gauges in capability data retrieval. If your R & R rates are above this level, there is a powerful tool for managing these prohibitively large rates. Working with the Douglass Index allows auditors to crunch data that may fall outside the […]
Read more »
Using OEE Metrics for All Process Steps
Published:Overall equipment efficiency (OEE) – the percentage of production time that is actually productive – has its roots in manufacturing where all production ceases when the equipment is offline. It is possible to gain a greater understanding of how effectively a system is operating, however, by expanding the concept to include all process steps in […]
Read more »Competently Use Capability Analysis
Published:The capability of a process, statistically speaking, is the ability of that process – based on historical performance – to achieve measurable results that satisfy established specifications and statistical limits. In a nutshell, process capability indicates how well a process is able to perform its specified purpose. Why is process capability important? When the capability […]
Read more »How to Explain and Understand Process Capability
Published:Have you tried to explain the concept of process capability to someone who then looks at you like you have two heads? Try using the following analogy to explain the subject more easily. Driving in a Construction Area Imagine you are driving on a highway that is undergoing construction. The width of your vehicle – […]
Read more »Understanding First Time and Rolled Throughput Yields
Published:Recently I visited several contract manufacturers (CM) to evaluate their ability to produce an electronic device that my company is developing for the automotive industry. I asked the project manager at each CM to provide me with an estimate of the typical rolled throughput yield (RTY) on their production lines. Only one of the project […]
Read more »Getting the Most out of a Capability Analysis
Published:The process capability indices Pp and Cp describe how closely a process can operate within its specification limits. Many articles describe the difference between Pp and Cp simply: one is short term, one is long term. Moving beyond such a description, this article focuses on the untapped power of capability analysis and shows you how […]
Read more »Table of the Standard Normal (z) Distribution
Published:Z score is a measure of the distance in standard deviations of a sample from the mean. It is calculated as (X – X bar) / sigma. The table of z distribution is shown below. Table of the Standard Normal (z) Distribution z 0.00 0.01 0.02 0.03 0.04 0.05 0.06 0.07 0.08 0.09 0.0 0.0000 […]
Read more »The Douglass Index Can Keep Good Data from Going to Waste
Published:In statistical process control, diligent technicians and auditors conduct detailed work to gather data for quality engineers, who then crunch the data into capability studies. Typically, the repeatability and reproducibility (R&R) rates for the data are first determined for the gauges used in the capability studies. The R&R studies are completed first to establish the […]
Read more »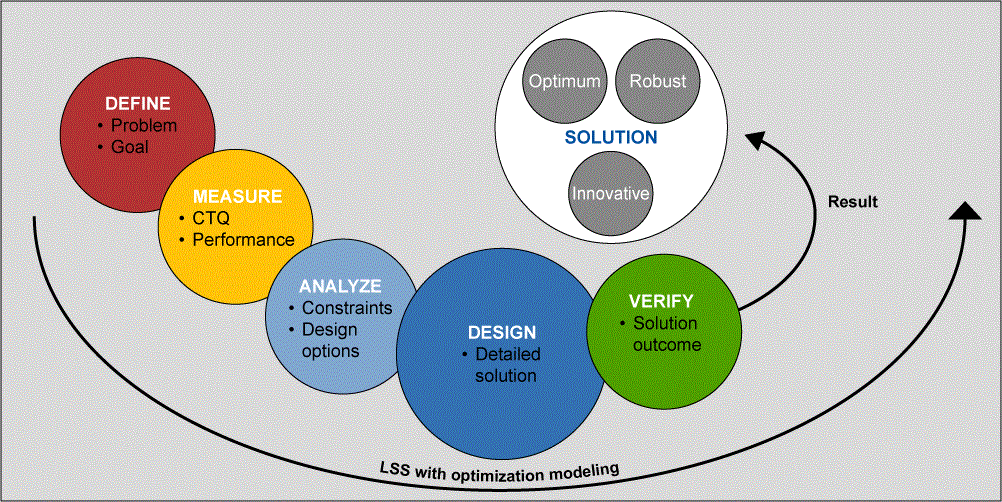
Overcoming Capacity Constraints with Optimization Modeling
Published:A leading manufacturer of color picture tubes launched a DMADV project to increase speed and, thus, improve productivity and throughput capacity.
Read more »Capability and Performance
Published:In my process engineering experience I have found a good number of people confused about the important process measure indices of capability and performance. The capability index is useful for measuring: Continual improvement using trends over time, or For prioritizing the order in which process will be improved, and For determining whether or not a […]
Read more »
50 Percent Sampling Savings with Sequential Test Method
Published:Using Wald’s sequential test method for process capability decisions can result in 50 percent sampling savings. Sequential testing can also be automated, enhanced and extended to the binomial, Poisson and reliability test areas.
Read more »How to Avoid Common Mistakes When Measuring Performance
Published:In manufacturing, key quality indices – performance capability index (Cpk), defects per million opportunities (DPMO) and first pass yield (FPY) – are prevalent criteria for gauging the performance of products and processes. These indices however, often are interpreted wrongly and used without taking into account the conditions of application. Moreover, alternative indices such as rolled […]
Read more »Resolving Common Issues with Performance Indices
Published:Measurements affect behavior. Wrong behavior results when metrics are confusing or do not represent what is truly happening. Leaders of many respected companies are paying the price for creating an environment in which measurements did not reflect accurately what was occurring in their organization. In contrast, the wise selection of metrics and their tracking within […]
Read more »
Cp, Cpk, Pp and Ppk: Know How and When to Use Them
Updated:For many years industries have used Cp, Cpk, Pp, and Ppk as statistical measures of process quality capability. Some segments in manufacturing have specified minimal requirements for these parameters, even for some of their key documents, such as advanced product quality planning and ISO/TS-16949. Six Sigma, however, suggests a different evaluation of process […]
Read more »Process Capability Calculations with Non-Normal Data
Published:During a Six Sigma project, the defect rate of the business process is calculated twice, first during the Define phase to show the impact of the problem and again during the Control phase to show how the process has improved. Although effective analysis of data that is not distributed normally is possible, completing one of […]
Read more »