Tag: Template
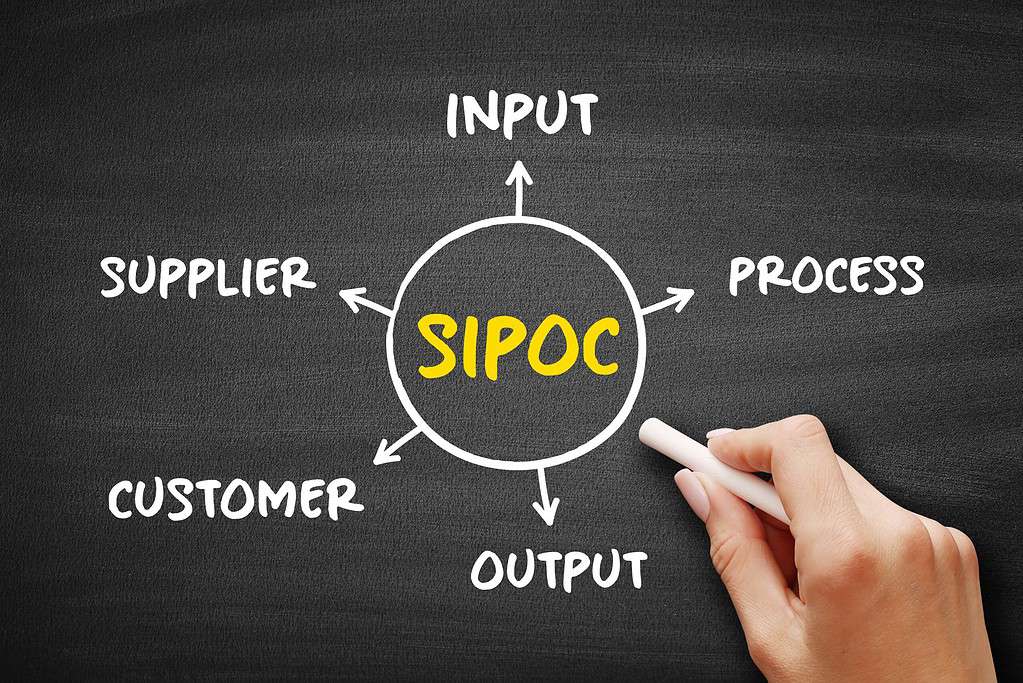
Get Your Team Up to Speed with the SIPOC Diagram
Published:There are a few different ways you can improve a process in your business. Before you get to work with implementing these changes, it does help to visualize the entire thing. A SIPOC diagram is a highly useful tool for mapping out the steps of a process. Processes and projects are complex, but a SIPOC […]
Read more »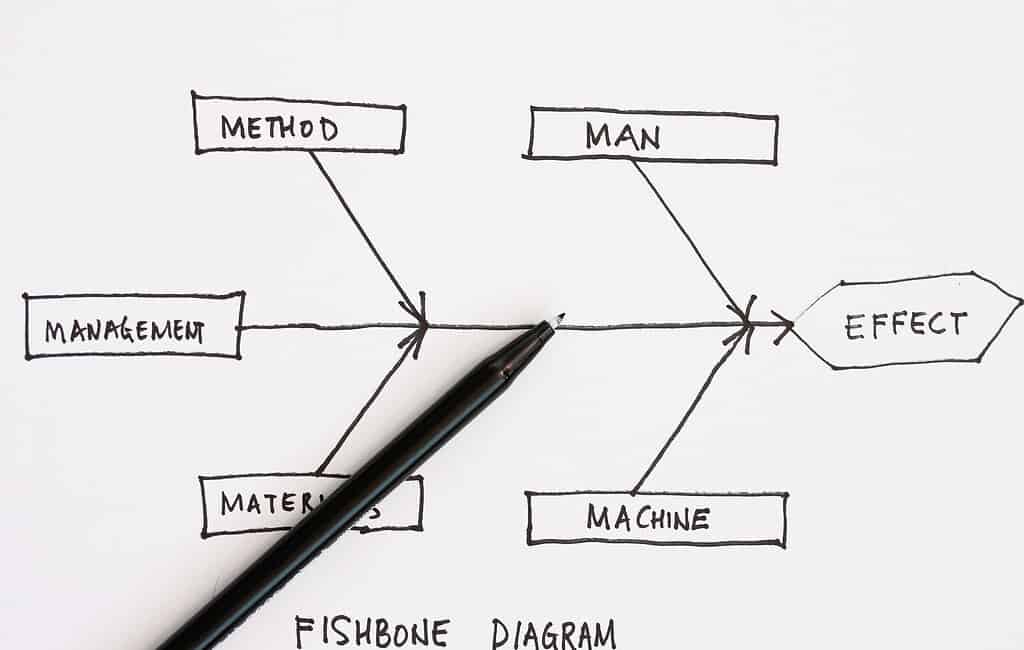
The Cause-and-Effect (a.k.a. Fishbone) Diagram
Updated:When utilizing a team approach to problem-solving, there are often many opinions as to the problem’s root cause. One way to capture these different ideas and stimulate the team’s brainstorming on root causes is the cause and effect diagram, commonly called a fishbone. The fishbone will help to visually display the many potential causes for […]
Read more »
Importance of Test Plans/Test Protocol: Go Into Testing Prepared
Published:Test plans, also called test protocols, are formal documents that typically outline requirements, activities, resources, documentation, and schedules to be completed. Some form of test plan should be developed before any test. The key reasons for developing test plans are: The Importance of a Plan Before embarking on any testing, experimentation, and so […]
Read more »
Six Sigma Project Charter (With Template)
Published:A project charter is the first step in the Six Sigma methodology. It takes place in the Define step of DMAIC (Define, Measure, Analyze, Improve, Control), and the charter can make or break a successful project. It can make it by specifying necessary resources and boundaries that will in turn ensure success; it can break […]
Read more »
Final Solution Via Root Cause Analysis (with a Template)
Updated:“Every defect is a treasure, if the company can uncover its causeand work to prevent it across the corporation.”– Kilchiro Toyoda, founder of Toyota When people discover problems, the most frequent response is to rush to find a solution. Finding an immediate fix for the problem is very satisfying, no matter how many times this […]
Read more »Step-by-Step Guide to Building Dynamic Pareto Charts
Published:While working in environments where costly statistical software is not easily accessible across the organization, an Excel-based Pareto chart is a practical alternative. Follow these straightforward steps to build a Pareto chart that can be updated with a click of a button.
Read more »
DOE for Services: Right Training Makes It a Valuable Tool
Published:When it comes to mastering design of experiments, there can be a steep learning curve. Through a DOE simulation, trainees can get firsthand experience applying DOE concepts, learning how to set up the experimental design and how to interpret its results.
Read more »