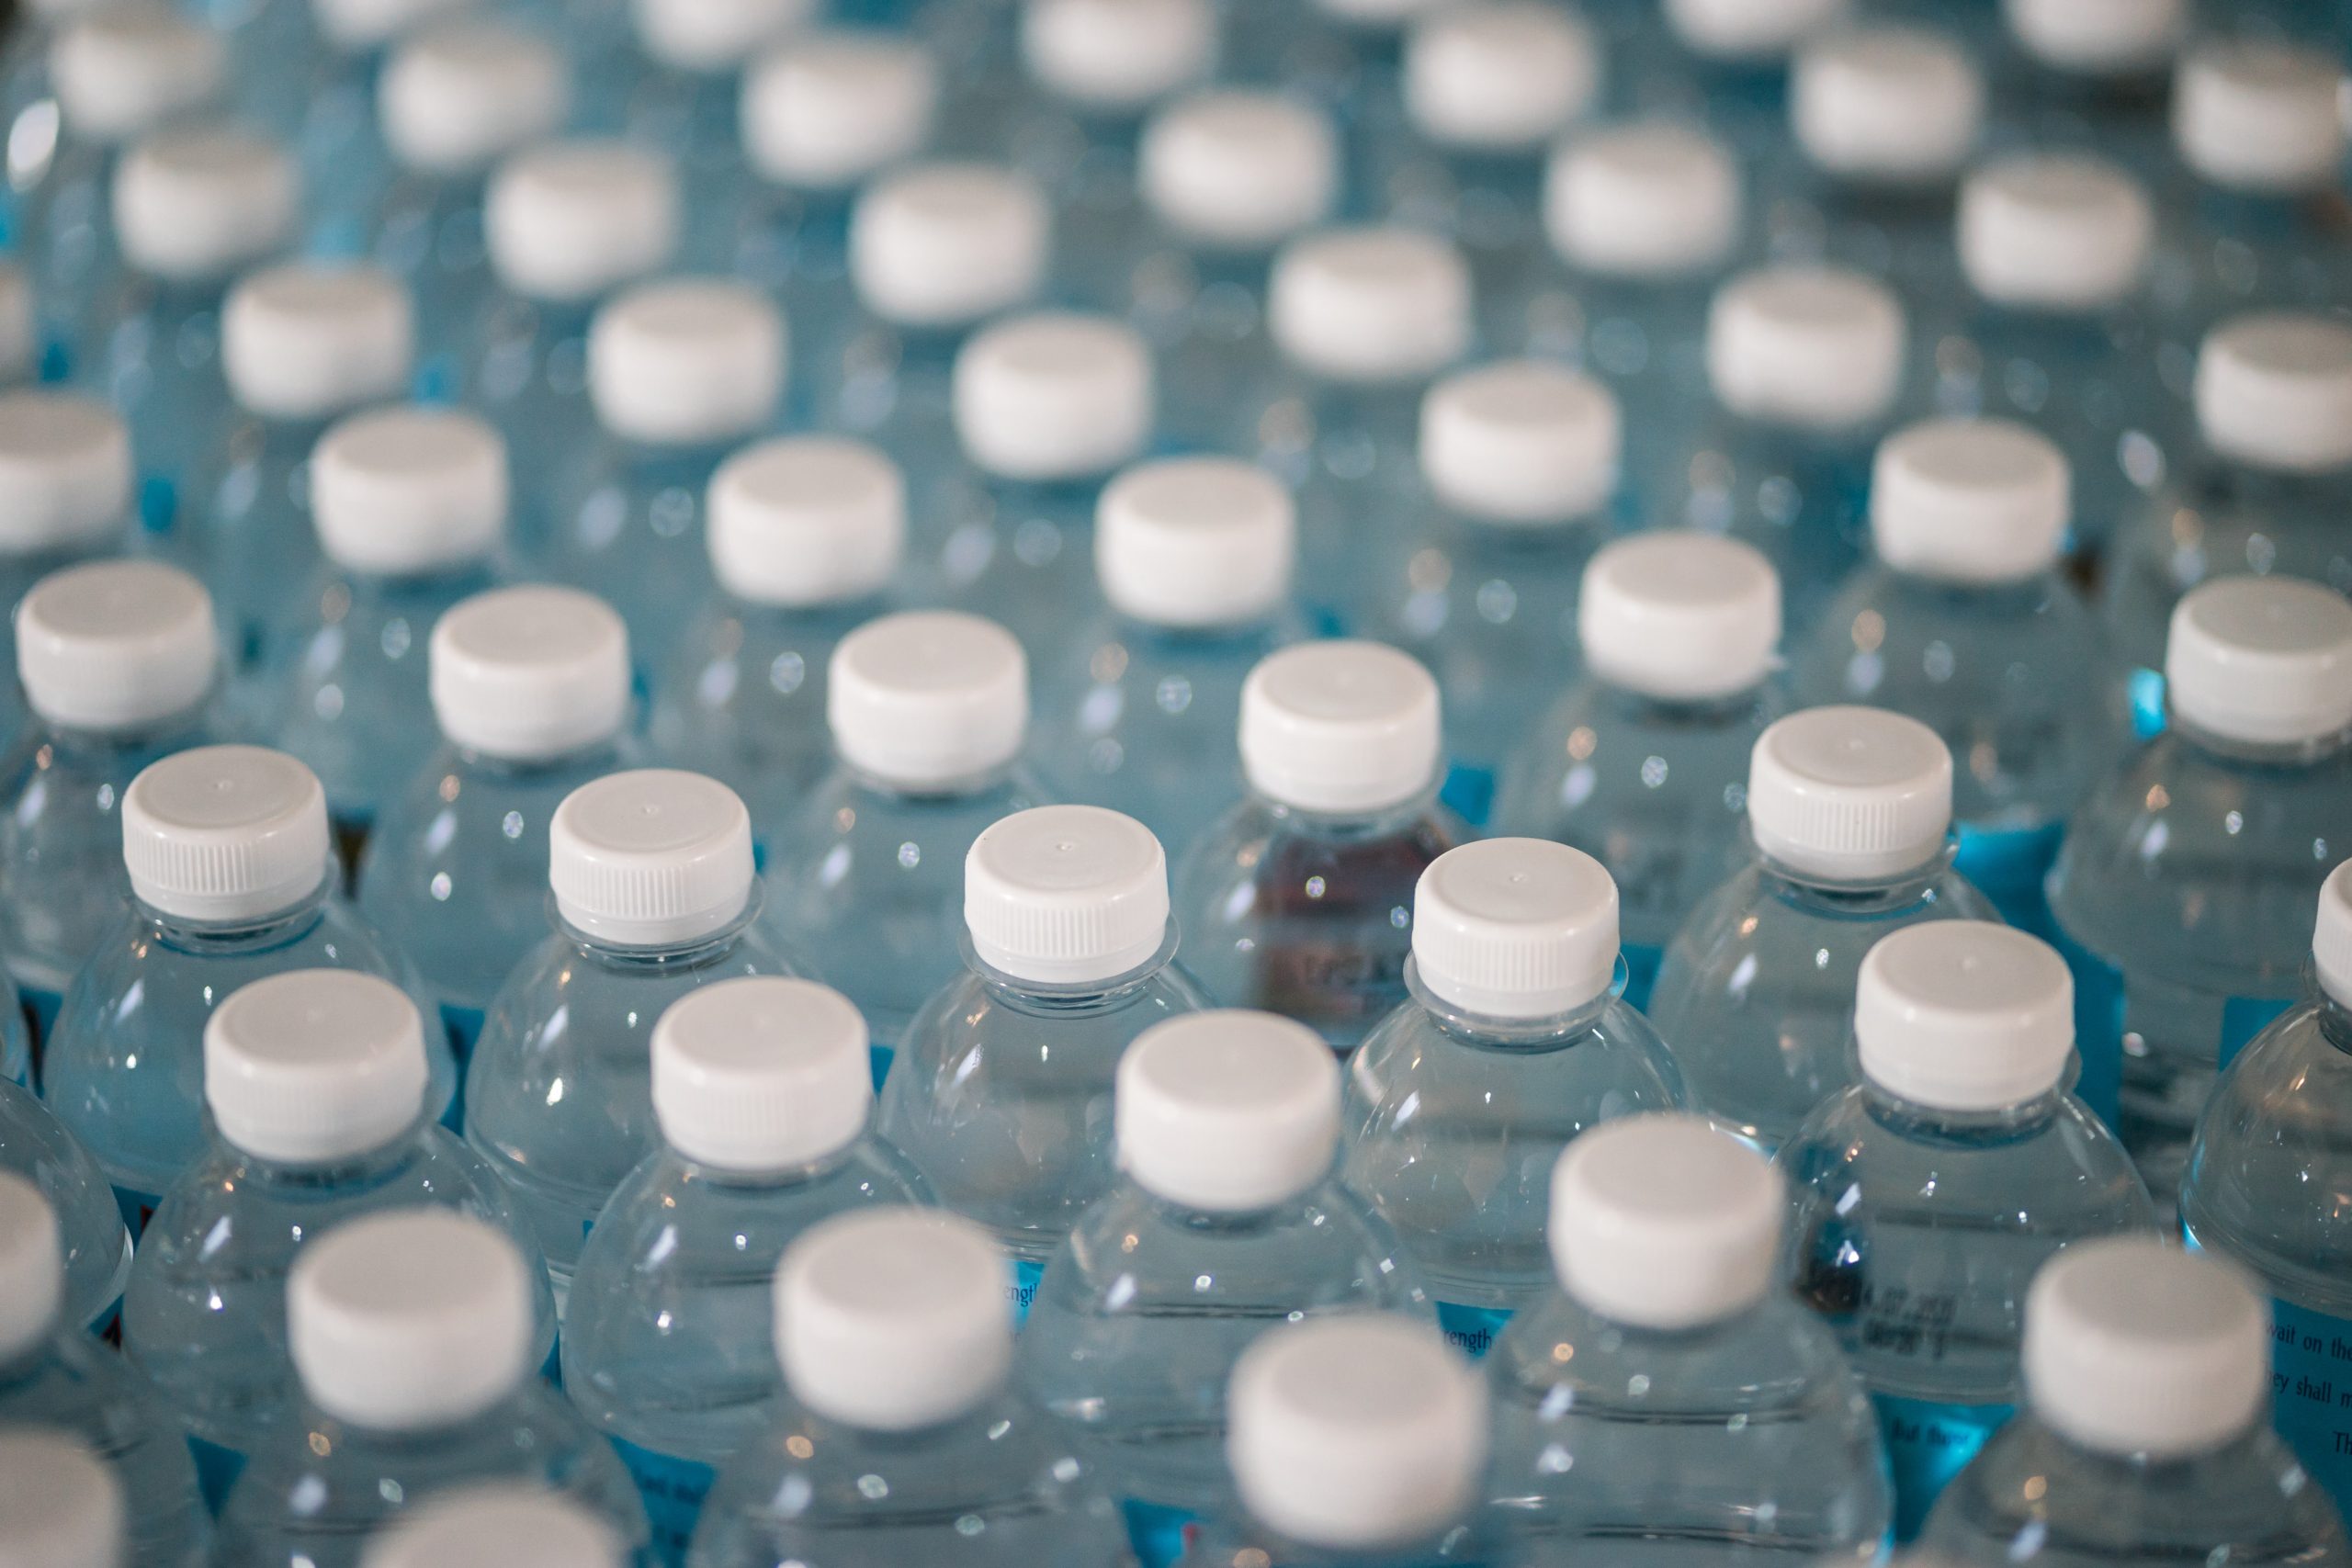
This major beverage manufacturer was spending millions of dollars per year to replace recyclable plastic shells to transport 2-liter bottles from the plant to their customers. Where did all the plastic shells go? Let’s find out.
The process of retrieving delivered plastic shells from the customer should have been easy, but apparently it wasn’t.
The process of returning plastic 2-liter bottle shells should have been easy. As the manufacturing site completes the filling process for 2-liter bottles of carbonated soft drink (CSD), they are placed in a plastic shell or tray in quantities of 8 bottles. These shells are stackable, so they are then stacked onto pallets. The pallets are loaded on trucks to be delivered to the customer. As the customer empties the shells, they are set aside for pickup by the delivery truck on their next delivery and returned to the plant for reuse.
This was the process for all manufacturing sites across the US. While this problem existed for most of the country, the Lean Six Sigma Black Belt(BB) reviewed the return data and concluded that one of the manufacturing sites (let’s call it site VX) had lower return rates than other similar sites. Jim, the BB, was assigned the project of improving the situation. Below is what one of the shells looks like:
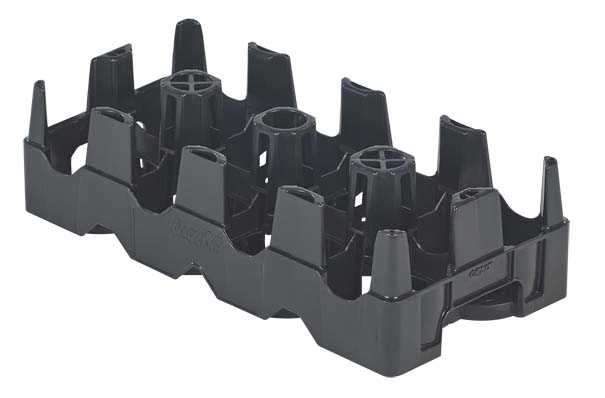
The name of the company is stamped on the side of the shell, so the customer knows who to return the shell to since there are several competitors who also use similar shells for their product deliveries. The common colors were red (Coke), blue (Pepsi) and green (Dr Pepper). Alternatively, black is also used by multiple suppliers.
The recovery rate for 2-liter shells from VX was 78%, which required the company to needlessly purchase 1,500,000 2-liter shells within the past 12 months. Since each shell cost approximately $1.78, the total cost of these excess shells was $2,670,000. While there was no expectation that VX could achieve a 100% recovery rate, they set a goal of increasing the current return from 78% to 90%. That would allow for a 12% reduction in the purchase of excess shells which would result in a capital reduction of $320,000.
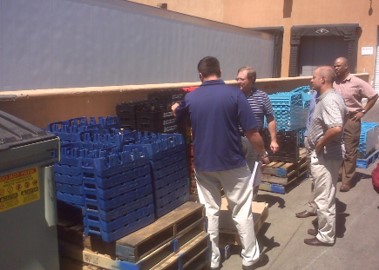
The photo below shows how customers separate the different shells and place them behind their stores for pickup.
Jim, the BB, formed an improvement team to collect and analyze data and then come up with recommendations for improvement.
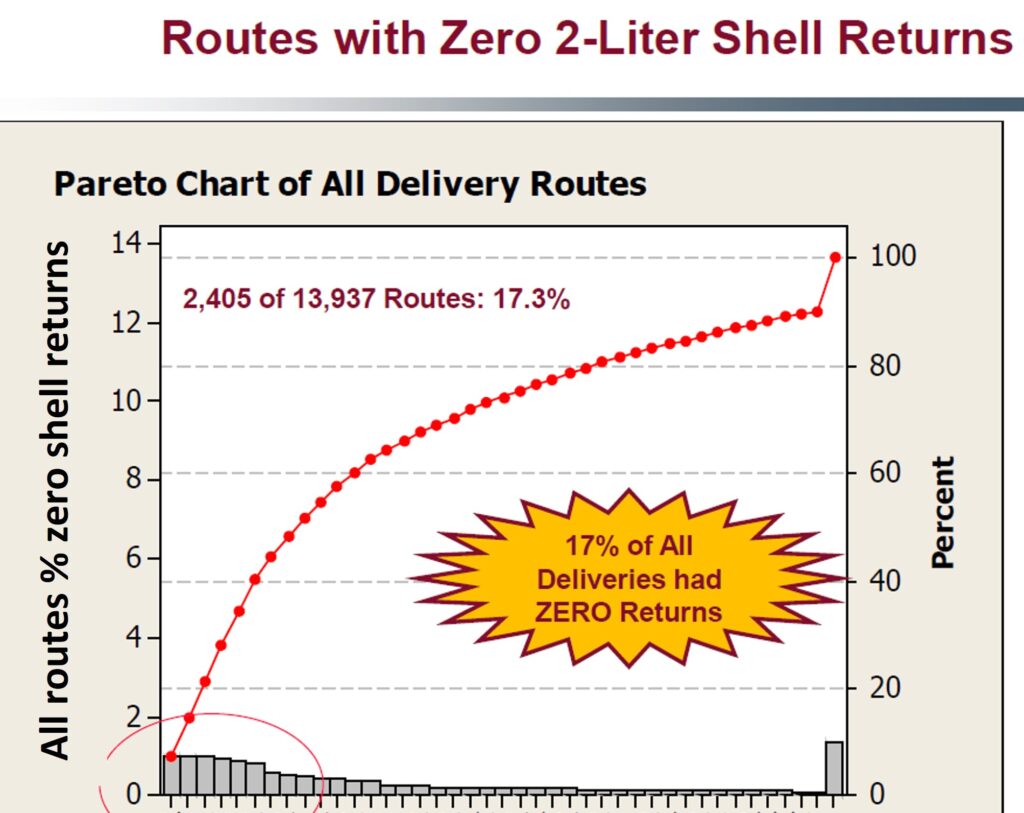
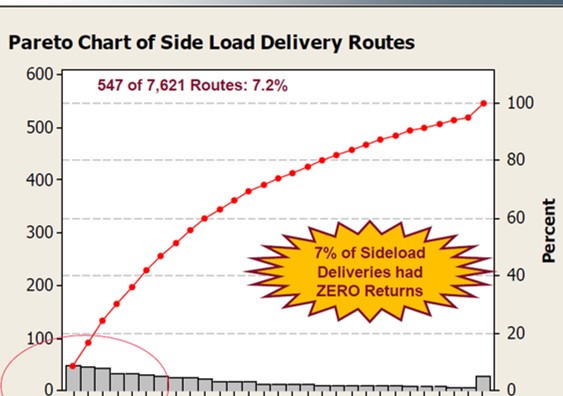
The first thing Jim did was to construct a Pareto chart of deliveries in which there were no returns. This turned out to show over 17% of all deliveries did not have any accompanying shell returns. He then broke it down by type of delivery vehicle and compared side load trucks (small deliveries) to bulk trucks used for large deliveries. The results of those Pareto charts are below.
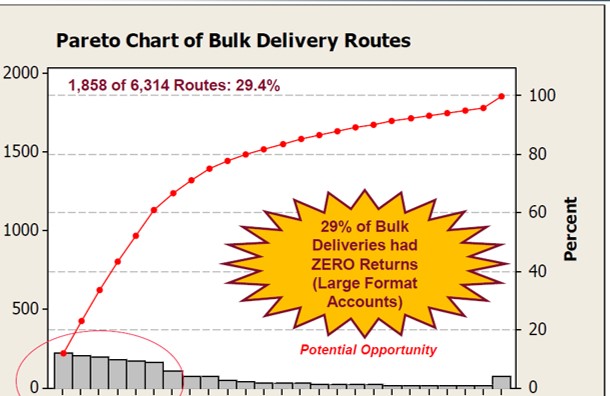
As you can see, 29% of all bulk deliveries failed to return any shells. Jim then did some brainstorming with the team as to why they thought drivers were not picking up shells. These were some of their reasons:
- Drivers don’t care – extra work
- Don’t understand importance of returning shells
- Easier not to do
- It takes an effort to do
- Adds time to their delivery so they may be late to their next delivery
- Time to find, separate and load shells
- Not Visible / have to look for shells
- Not separated from competitor shells
- Physical Conditions – Dirty and hard to reach
- Not a driver’s regular store or stop
Other reasons were:
- Customers not separating and placing shells in a secure and accessible location
- Company’s shells are nearly identical to competitor’s shells
- No clear instructions or accountability for returning shells
- Inventory and quantities not transparent
- Complexity and time to count and record return amounts
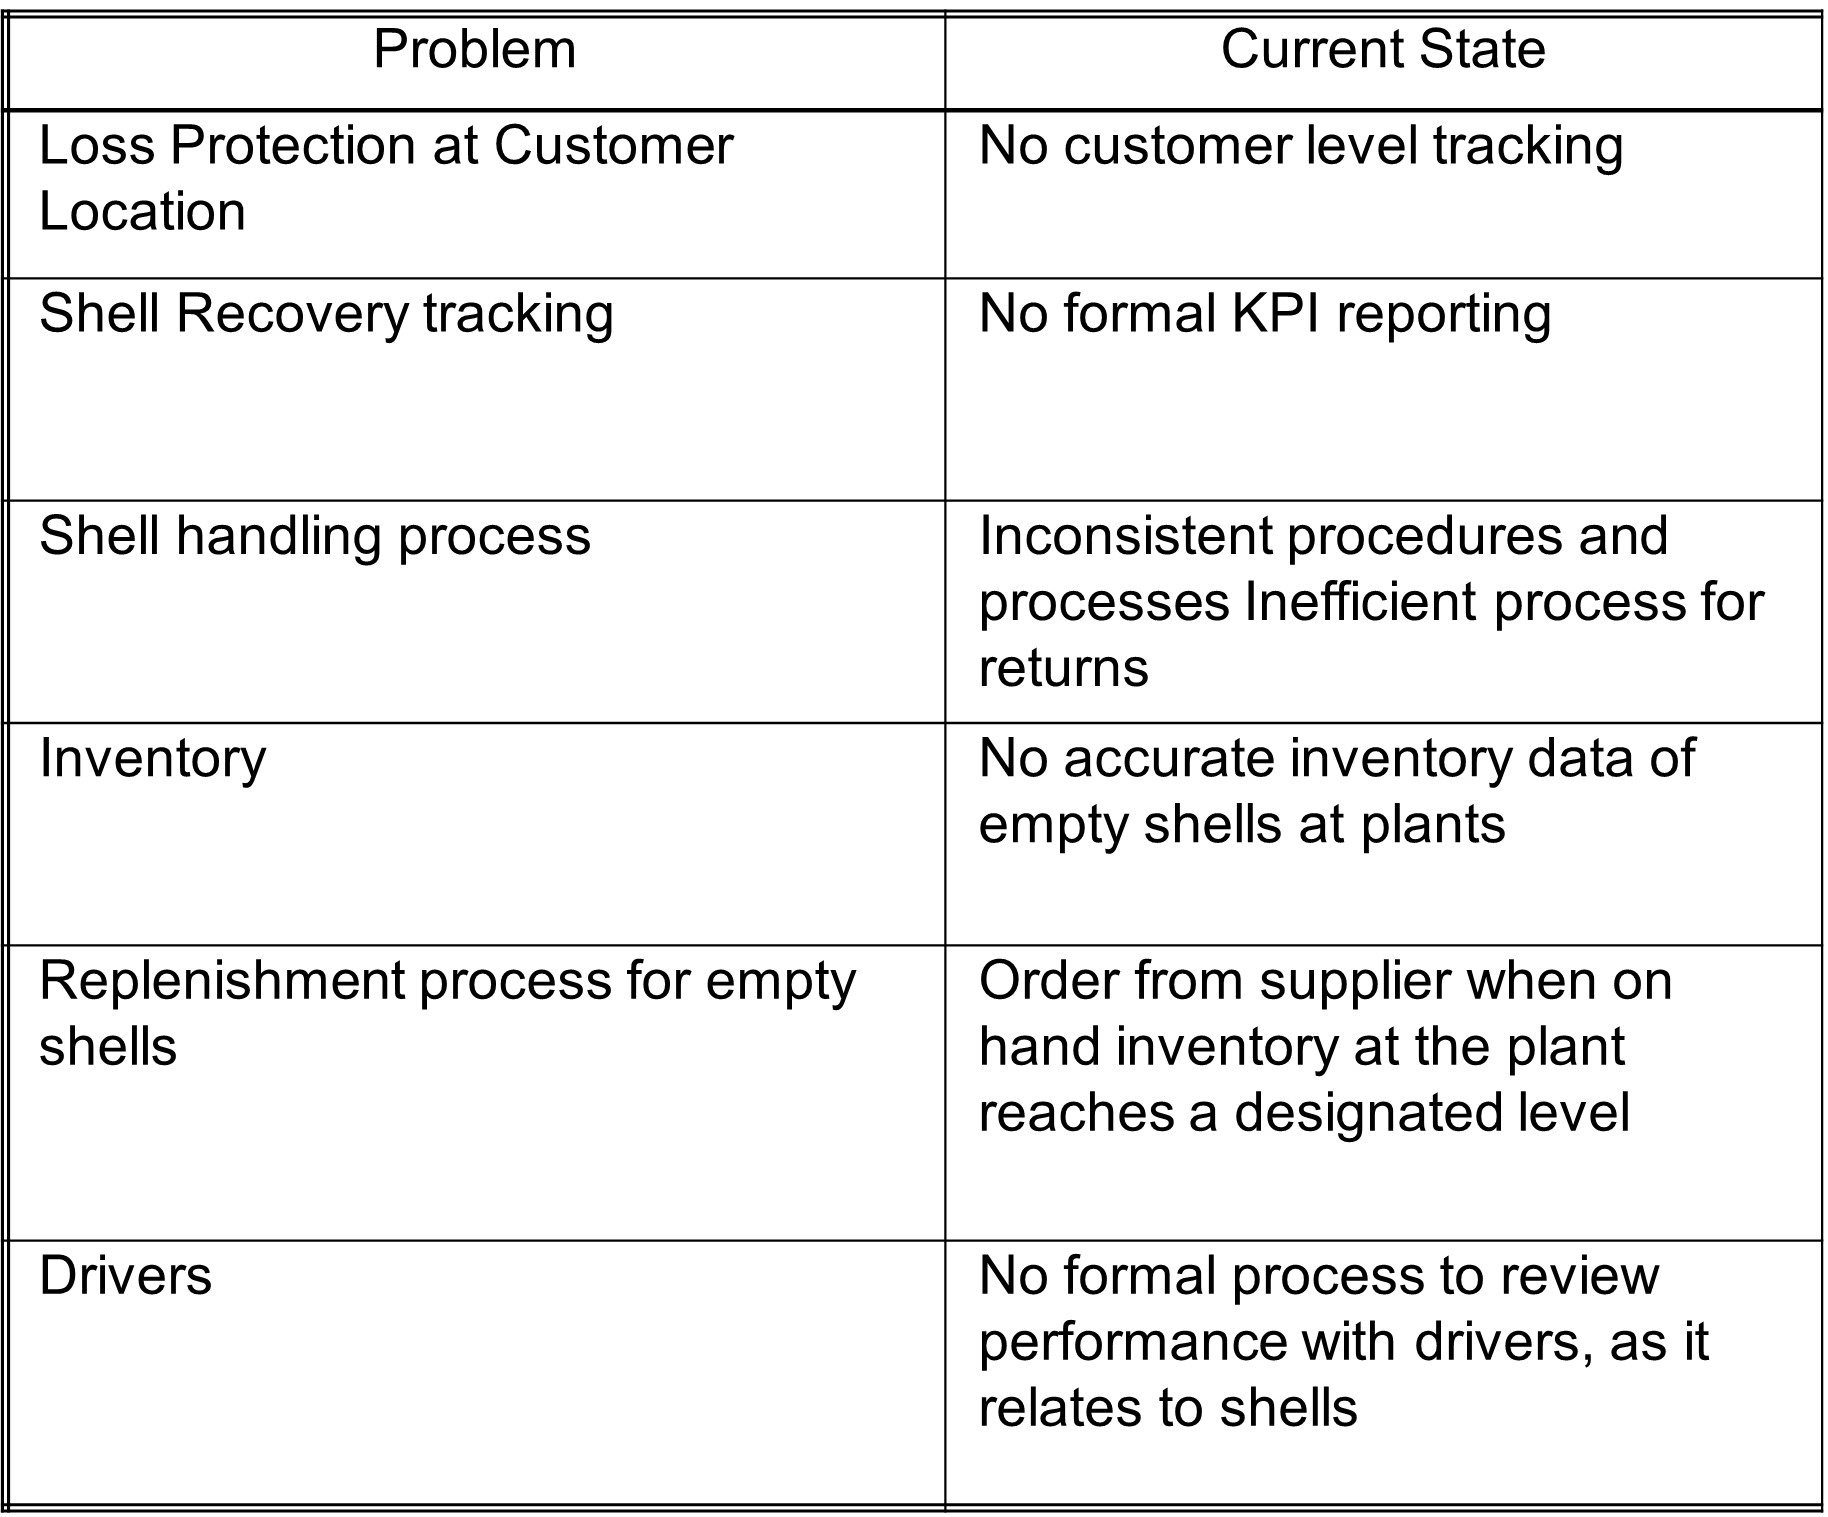
The team summarized the potential issues in the table below:
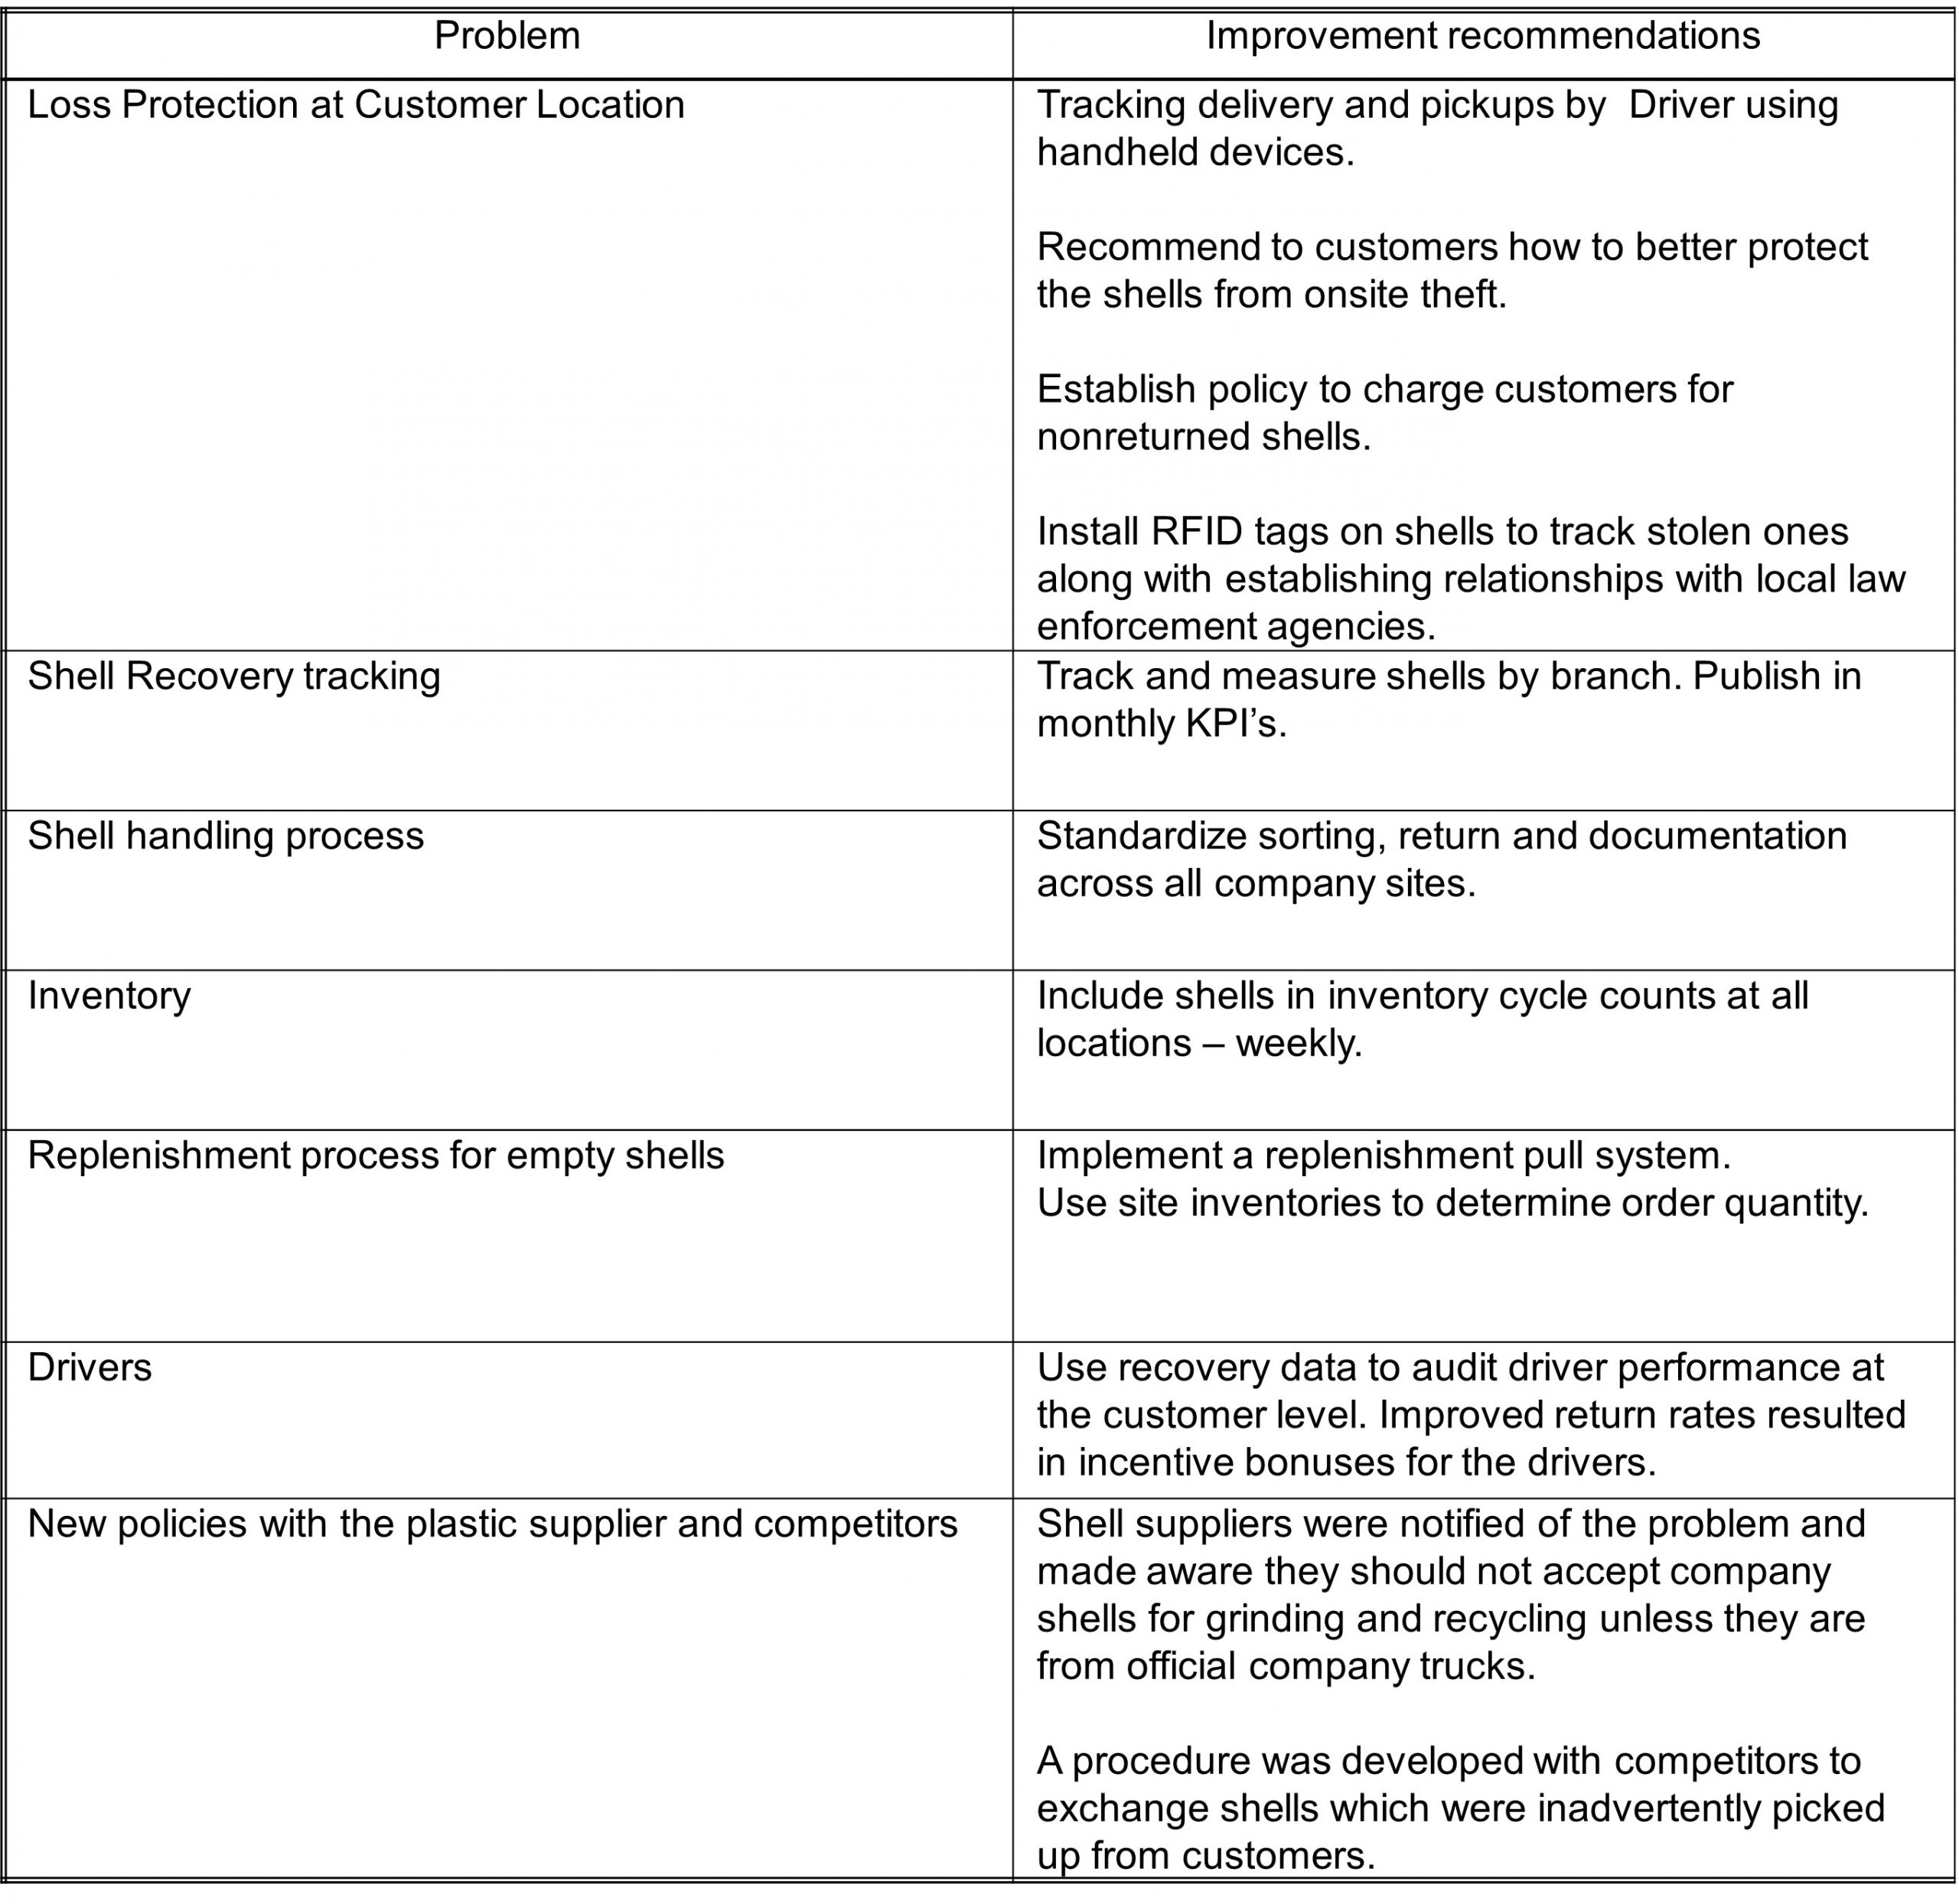
The team proceeded to come up with recommendations to solve the issue of shells not being returned.
Using such Six Sigma tools as brainstorming, affinity diagrams, fishbone diagrams, Pareto charts and Cause and Effect matrices, the team came up with the following recommendations.
After implementing these recommendations and tracking any changes in the quantity of shells being returned, there was still a gap in the number of shells delivered and those recovered. Audits indicated that the drivers and customers were following the process, yet shells were disappearing.
The last improvement idea implemented was the use of RFID tags on the shells. The company interacted with local law enforcement to monitor the tags and try to see where they were. Experience had indicated that, at times, shells were stolen from the customer sites and taken to the local plastic recycler who paid a lot of money for the shells. They were then ground up and, in many cases, sold back to the company as new recycled shells.
After a week of tracking the shells, you won’t believe what the police found.
While the company and law enforcement were upset about the thefts, they were amazed at the creativity of the thieves. Below is where many of the stolen shells ended up.
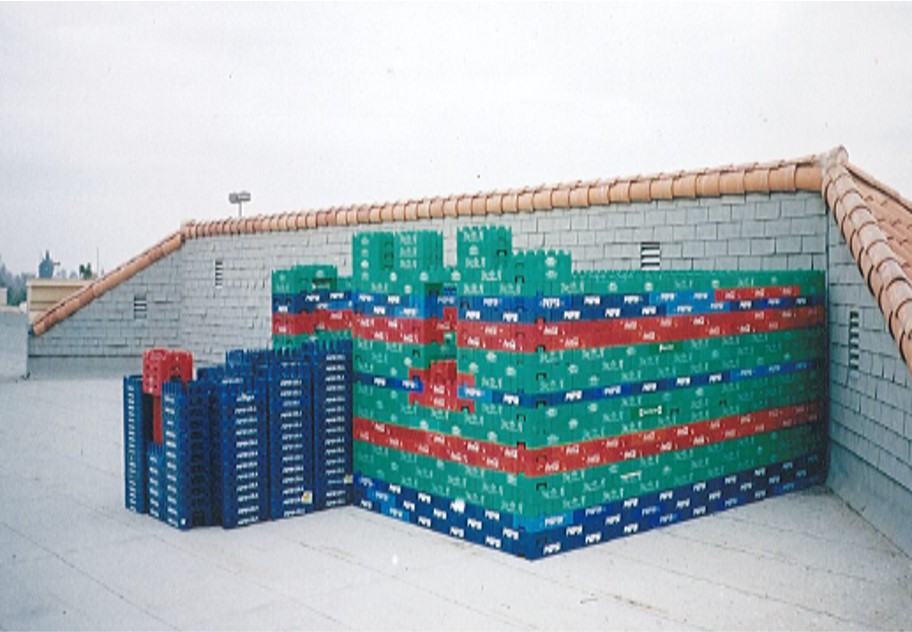
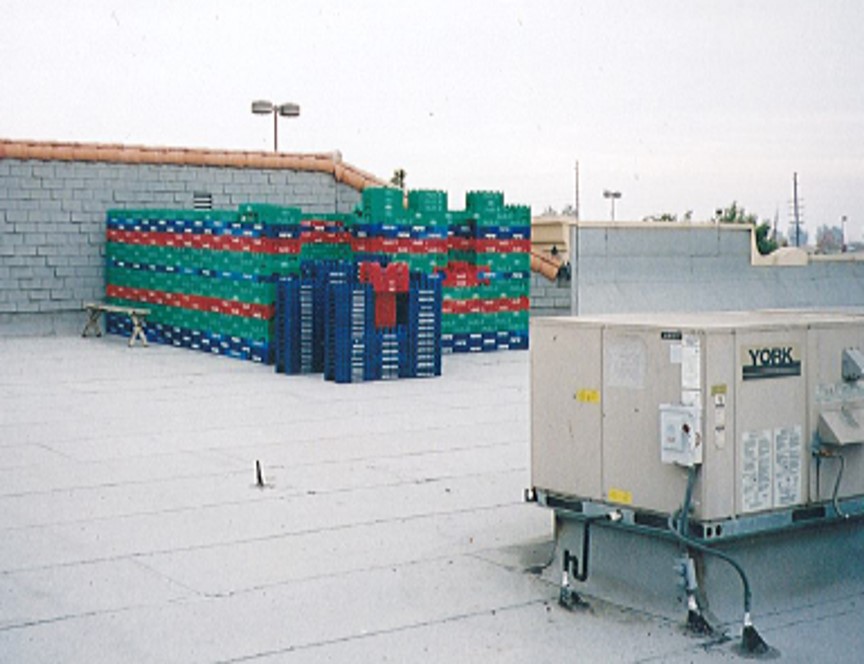
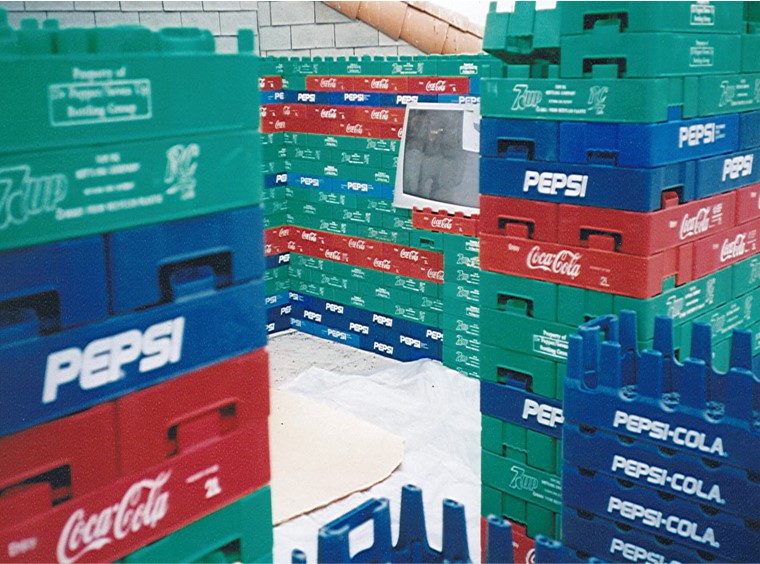
It turns out that homeless people were stealing the shells and then building a shell home on the roofs of commercial buildings in the area. The plastic shells were waterproof and good for insulation. The one pictured above was still under construction awaiting the tarp roof. Also note the simulated big screen TV in the photo above.
The outcome of the project yielded extensive benefits for the company.
After monitoring and tracking shell returns for three months, Jim reported that shell yield had increased from the original 78% to 91% which was greater than the target of 90%. The drivers were happy because of the additional incentive pay and the use of handheld devices. The customers were happy because they avoided penalty charges for lost shells. Manufacturing was happy because they had sufficient shells on hand and production was not interrupted by low inventories of shells onsite.
Finance was happy because they no longer had to needlessly spend capital dollars to purchase shells. Since shells were recyclable, they were treated as capital dollars rather than expense dollars. The reduction of capital expenditures for shells, just for the VX site, was estimated at $545,000 annually. Jim replicated this project at the remaining company sites. The annual impact across the company was estimated to be $3,560,000.